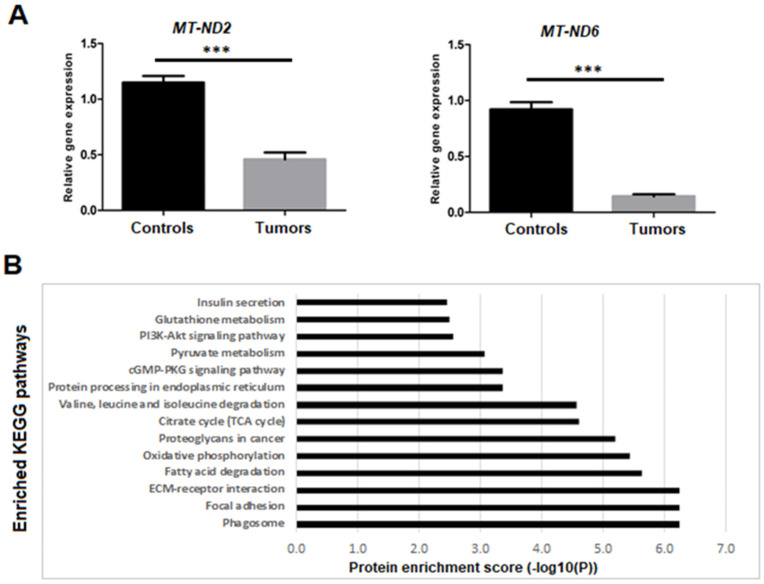
Figure 4.
Mitochondrial genes and proteins expression analysis. (A) Relative expression of MT-ND2 and MT-ND6 with significant difference between tumors and controls (p-values calculated by t-test, *** <0.0001). (B) Functional enrichment analysis of differentially expressed proteins, using PROTEXA program. Bar graph of enriched KEGG biological pathways in proteins is shown.

