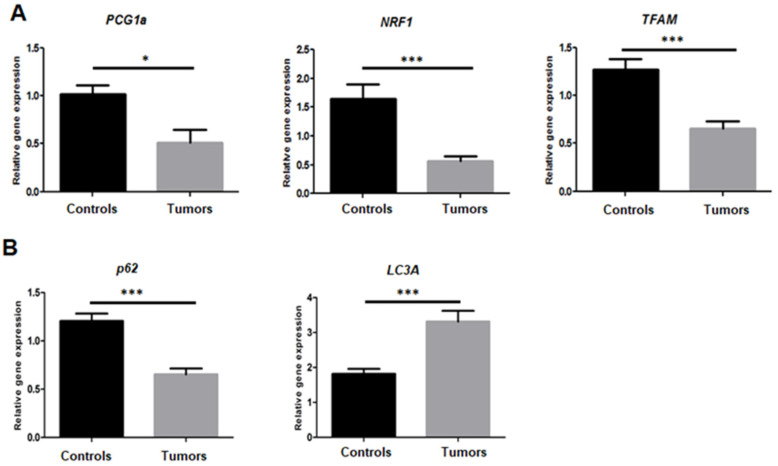
Figure 5.
Mitochondrial biogenesis and mitophagy analysis. (A) Relative expression of mitochondrial biogenesis markers: PCG1α, NRF1, and TFAM genes with significant difference between tumors and controls (p-values calculated by t-test; * <0.05 and *** <0.0001). (B) Relative expression of mitochondrial mitophagy markers: P62 and LC3a, with significant difference between tumors and controls (p-values calculated by t-test; *** <0.0001).

