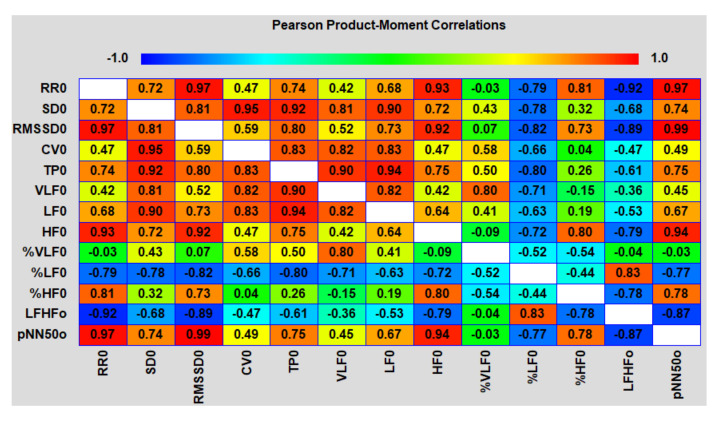
Figure 14.
Correlation matrix between the HRV indices at the initial stage (with the descriptor 0 at the end) of the test packs in the interval of 0–3 h (up to the point of intersection of the two green straight trend lines in Figure 14, corresponding to 13 h 30 min).

