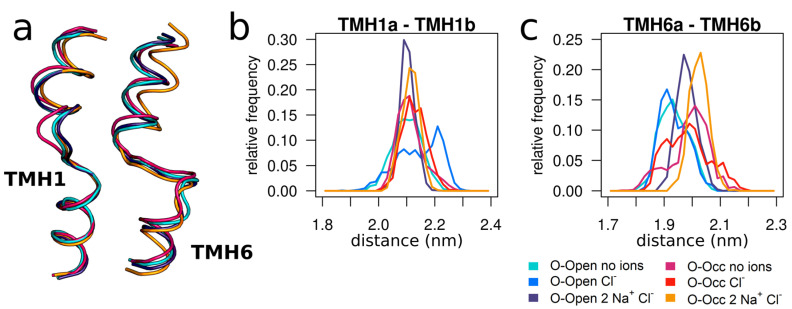
Figure 4.
Na+ binding constrains the distances from TMH1a to TMH1b and from TMH6a to TMH6b. (a) Overlay of TMH1 and TMH6 (fitted to TMH1a and TMH6b) of representative structures. (b) Distance distributions of TMH1a (residues 86–95)–TMH1b (residues 99–111). (c) Distance distributions of TMH6a (residues 328–338)–TMH6b (residues 343–350). The last 250 ns of 5 parallel simulations with a 1 ns temporal resolution were used for the analysis.

