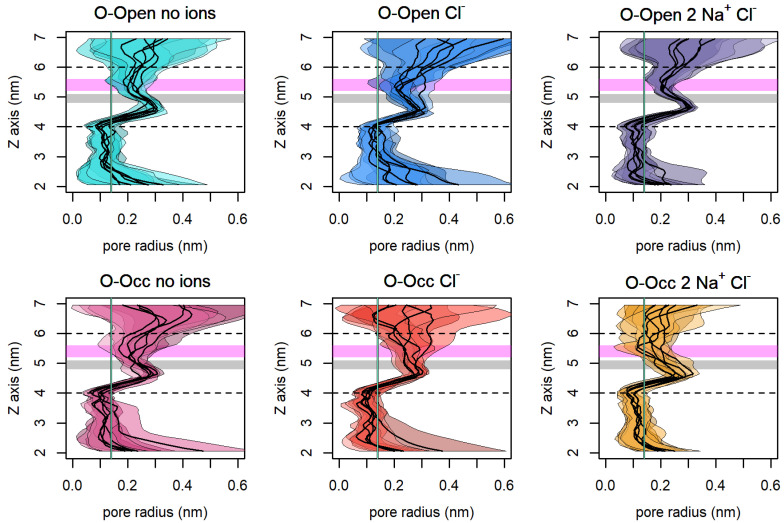
Figure 7.
Mean pore radius ± standard deviation along the z-axis for every trajectory. The gray area indicates the extracellular hydrophobic lid, and the magenta area represents the extracellular salt bridge. The dashed lines show the bottom of the S1 binding pocket (at 4 nm) and the outer end of the extracellular vestibule (at 6 nm). The aquamarine vertical line indicates the radius of a water molecule (0.14 nm) for a comparison. The vestibule was considered closed if smaller than the size of a water molecule. Trajectories were analyzed every 1 ns.

