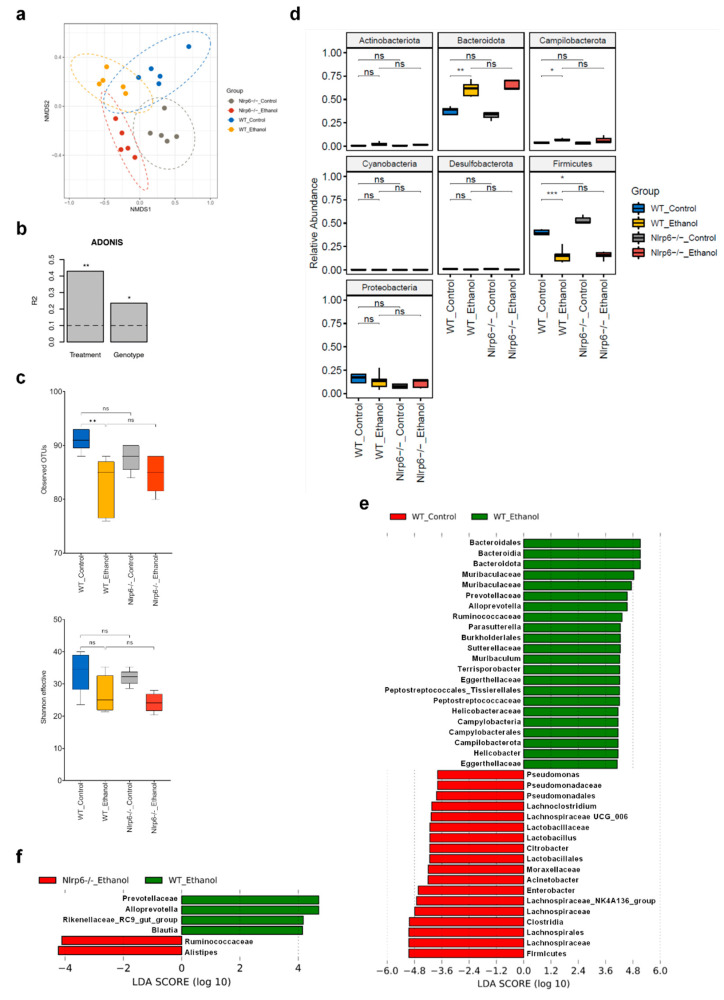
Figure 3.
Cecal microbiota is altered markedly upon chronic alcohol treatment but only marginally by additional Nlrp6 deletion. (a) NMDS analysis based on the Bray-Curtis distance metric from ethanol- and control-fed WT and Nlrp6−/− mice. Every point represents one mouse, and ellipses indicate 95% confidence levels for each group of mice. (b) Permutational multivariate analysis of variance (ADONIS) using the Bray-Curtis metric of samples as in (a), considering factors treatment and genotype. (c) Alpha-diversity analysis of samples as in (a), based on the number of observed OTUs and the Shannon effective index. (d) Relative abundance of intestinal bacteria at the phylum level using samples as in (a). (e) LEfSe analysis comparing cecal stool samples from ethanol-fed WT with control-fed WT mice. (f) LEfSe analysis comparing cecal stool samples from ethanol-fed Nlrp6−/− with ethanol-fed WT mice. Data represent results from five mice per group; bar plots display mean; box plots indicate median ± interquartile range and maximum/minimum; *** p < 0.001, ** p < 0.01, * p < 0.05, ns = not significant.

