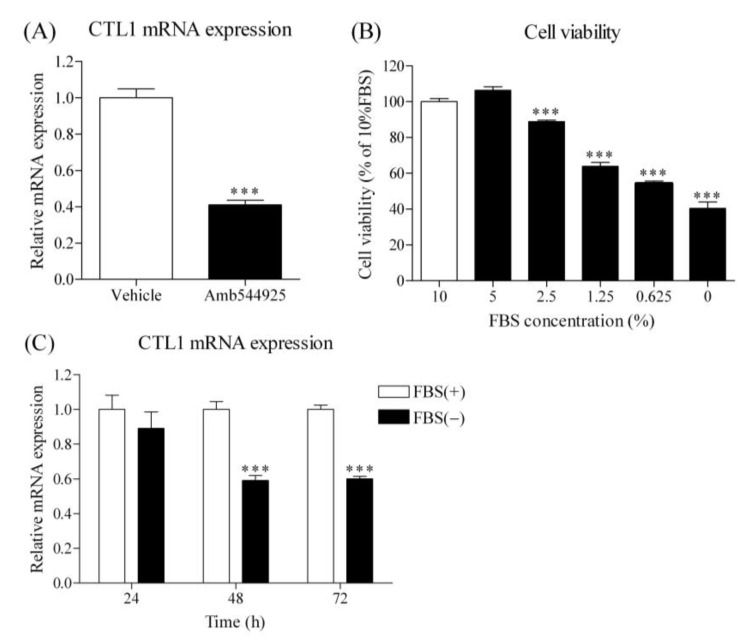
Figure 8.
Effect of Amb544925 and FBS on CTL1 mRNA expression in HSC-3 cells. (A) Cells were incubated with 10 μM Amb544925 for 24 h, and then CTL1 mRNA expression was measured by real-time PCR (n = 4). The expression level of CTL1 mRNA was expressed as the ratio of the expression level of Amb544925 treatment to that of the vehicle control. *** p < 0.005 compared to the vehicle control. Effect of FBS on cell viability (B) and CTL1 mRNA expression (C) in HSC-3 cells (n = 4). The cell viability of HSC-3 cells cultured in medium containing various concentrations of FBS for 48 h was measured. Results are given as a percentage of cell viability measured in the presence of 10% FBS. *** p <0.005 compared to 10% FBS. (C) Effect of FBS on CTL1 mRNA expression in HSC-3 cells (n = 4). Cells were cultured in the presence (FBS+) and absence (FBS−) of 10% FBS for 24, 48, and 72 h, and then CTL1 mRNA expression was analyzed by real-time PCR. *** p < 0.005 compared to 10% FBS (FBS+).

