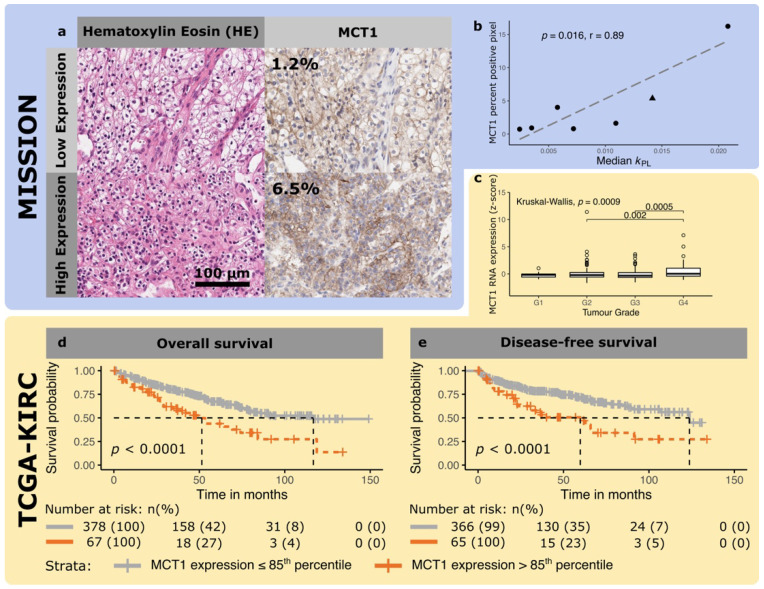
Figure 4.
Representative micrographs of a clear cell renal cell carcinoma with high and low expression of MCT1. (a) The left panels show a hematoxylin and eosin stain, and the right panels the corresponding immunohistochemical stain for MCT1 on an adjacent tissue slice. (b) Correlation between MCT1 IHC expression and kPL in the patient dataset imaged as part of this study (MISSION, dots represent ccRCC, the triangle the liposarcomas) (c) Box plot comparing z-transformed MCT1 expression as a function of histological tumor grade from a Cancer Genome Atlas dataset (TCGA-KIRC, yellow). (d) Kaplan–Meier plots for the association of MCT1 expression with overall and (e) progression/recurrence-free survival using an expression cut-off at the 85th percentile in the TCGA-IRC dataset. MCT1 expression was significantly associated with overall and progression/recurrence-free survival.

