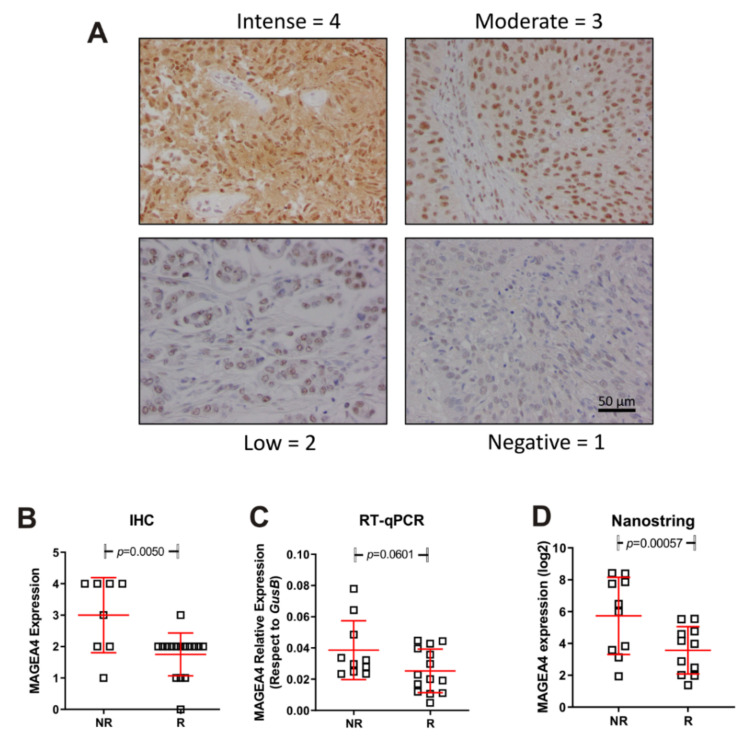
Figure 4.
Expression of MAGEA4 in responders (R) and non-responders (NR). (A) Representative examples corresponding to the different IHC scores. (B–D) Summary of the MAGEA4 expression measured by IHC (B) mRNA expression by probe hybridization in nCounter Nanostring platform (D), mRNA expression by RT-qPCR (C). p-Values were estimated by un-paired T test.

