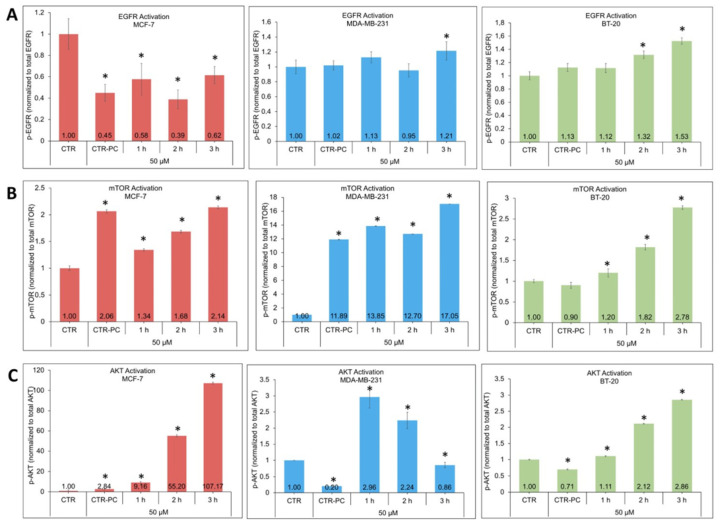
Figure 2.
Calculation of the p-EGFR/EGFR ratio, (A) p-mTOR/mTOR and (B) p-AKT/AKT (C) for each experimental group (n = 6 in each experiment) treated with 50 μM sapienic acid for the indicated time; CTR-PC = pulse and chase experiment (see Section 2). Values were mean ± SD. * Values significantly different from control (p < 0.001). Western blot analyses are shown in Figures S3–S5 in Supplementary Information.

