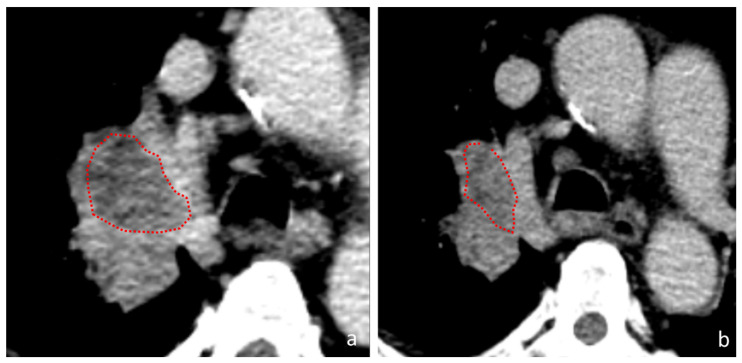
Figure 4.
A tumor in the right pulmonary hilum. (a) baseline CT-scan (b) first assessment CT-scan. During follow-up, the tumoral mass shrunk a variation consistent with PR. At the first re-evaluation the central hypodense area reduced (red dotted circles); this tumor presented a ∆-LALGLE of 1.487953173, which consists of a reduction of 149% of the low attenuation area.

