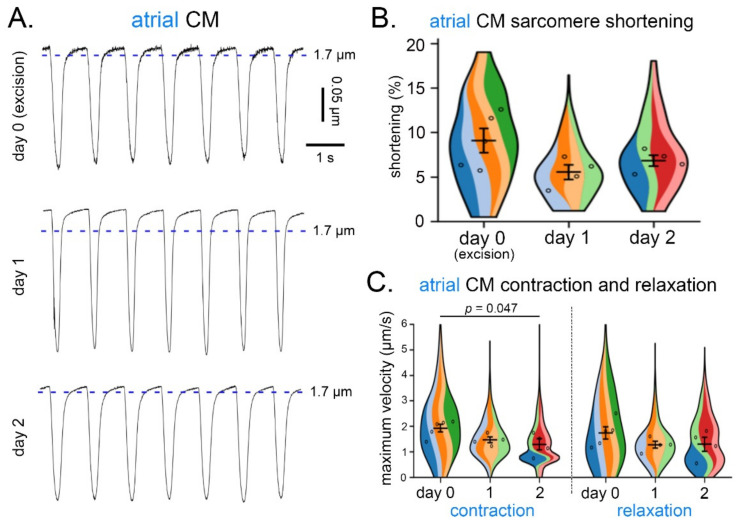
Figure 5.
Contraction and relaxation of atrial CM over three consecutive days of cell isolation from live cardiac tissue slices of the same heart. (A) Recordings of sarcomere shortening (in response to field stimulation at 1 Hz) over three consecutive days of CM isolation from the same heart. (B) Degree of sarcomere shortening (%) in atrial CM (free wall and appendage combined) over three days of CM isolation. (C) Maximum velocity of contraction and relaxation in atrial CM (free wall and appendage combined) over three consecutive days of CM isolation; n = 4–5 hearts, 40–70 CM/day of isolation. (B,C), each color represents data from one heart. Within each colored area, the open circles represent the average of all cells recorded from the same heart.

