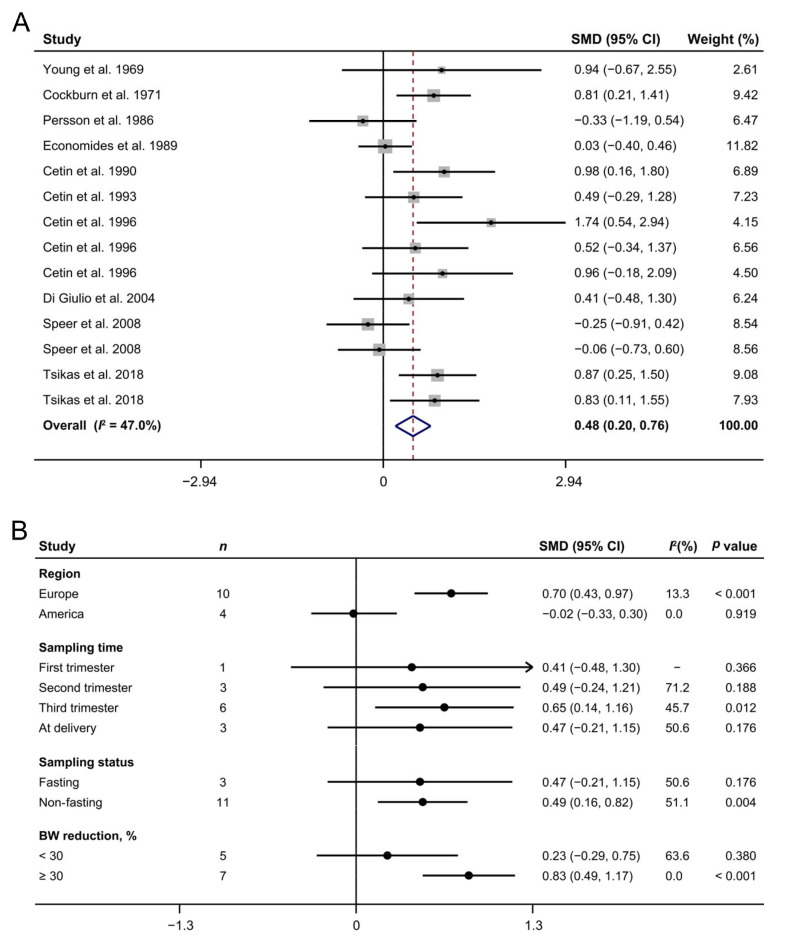
Figure 2.
The forest plot shows the maternal arginine concentrations in intrauterine growth restriction pregnancies (A) as well as their subgroup analyses (B). The solid black circles mean the estimate of SMD. The horizontal lines indicate the 95% CI of this effect, and the sizes of the gray boxes suggest the relative weight of each publication. An open diamond denotes the overall SMD determined using a random effects model. The value on the x-axis corresponds to the SMD of maternal arginine concentration. Heterogeneity among the publications was estimated using the I2 statistic, with 0–25%, 25.1–75%, and 75.1–100% representing low, moderate, and high degrees of heterogeneity, respectively. BW, body weight; SMD, standard mean difference.

