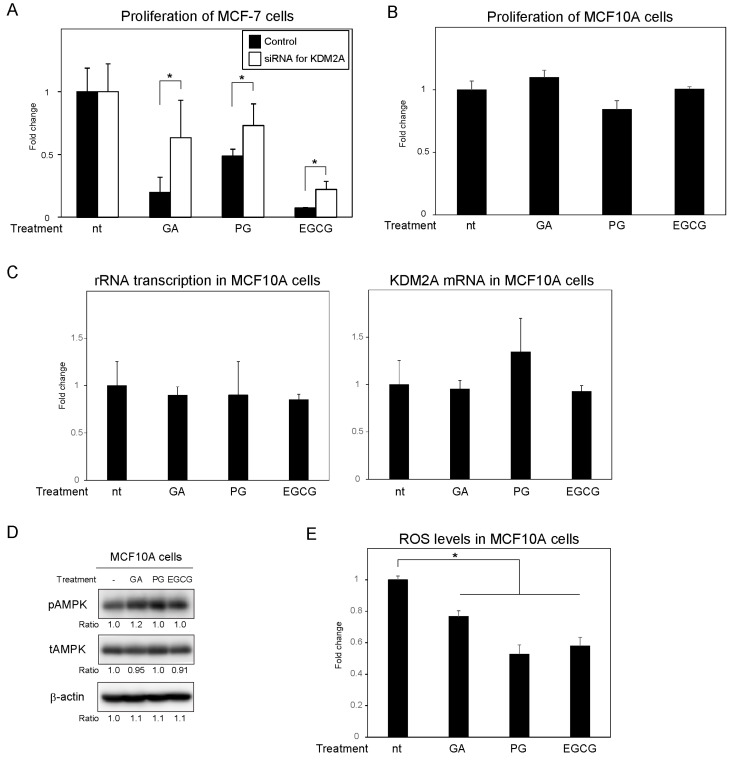
Figure 4.
Impact of PG and EGCG on the proliferation of MCF-7 and MCF10A cells. (A) MCF-7 cells transfected with control siRNA or KDM2A siRNA were treated with 50 μM GA, PG or EGCG for 2 days. Cell proliferation was analyzed using the CyQUANT® direct cell proliferation assay. The results are shown as the fold change in relation to cells treated with siRNA in the absence of compounds. (B) MCF10A cells were treated with 50 μM GA, PG, or EGCG for 2 days. Cell proliferation was analyzed, as in (A). The results are shown as the fold change in relation to cells in the absence of compounds. (C) MCF10A cells were treated with 50 μM GA, PG, or EGCG for 4 h. Total RNA was extracted, and the levels of rRNA transcripts (pre-rRNA) (left panel) and KDM2A mRNA (right panel) were determined using qRT-PCR. The results are shown as the fold change in relation to cells in the absence of compounds. (D) MCF10A cells were treated with 50 μM GA, PG, or EGCG for 4 h. The cells were then lysed and the levels of phosphorylated-AMPKα (Thr172) (pAMPK), total AMPKα (tAMPK), and β-actin were analyzed via immunoblotting. (E) MCF10A cells were treated with 50 μM GA, PG, or EGCG and cultured for 4 h in the presence of DCFDA, a cell-permeable ROS probe. Fluorescence was measured and the signal intensity was normalized to that of blank condition (no cells) without treatments. The results are presented as the fold change from cells without treatment. All experiments were performed more than three times, and the mean values with standard deviations are shown. * p < 0.05.

