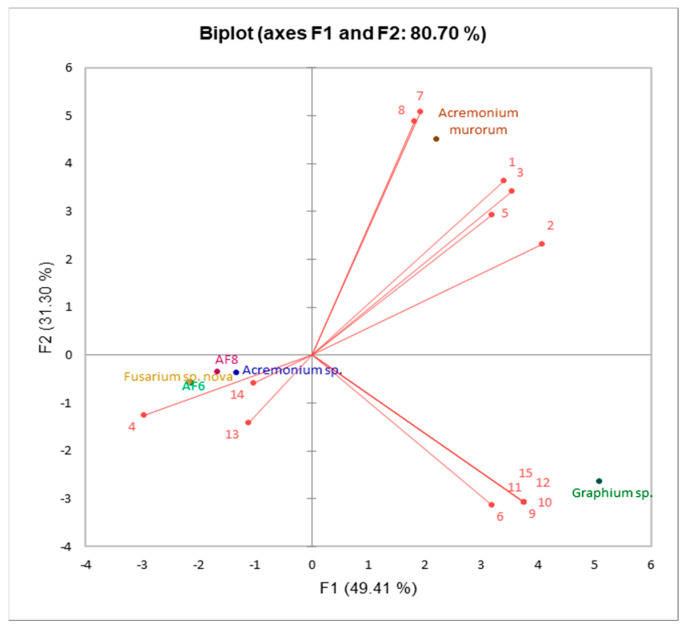
Figure 3.
Principal component analysis (PCA) plot of the scores (volatile compounds emitted by symbionts) loading by dotes and loadings (symbionts) indicated by lines based on the first and second principal components. Numbers represent the compounds 1 to 15 in Table 1.

