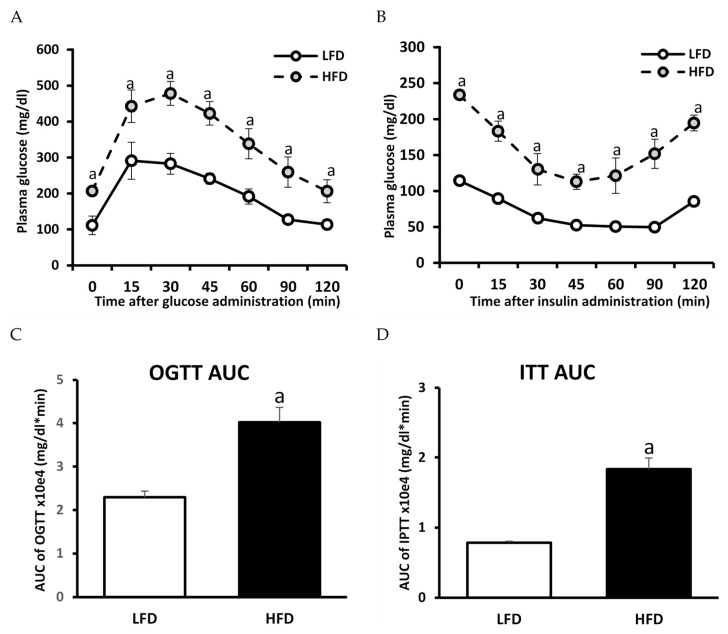
Figure 3.
Impact of high-fat diet (HFD) consumption on plasma glucose profile during oral glucose tolerance test (OGTT) and intraperitoneal insulin tolerance test (ITT): Panel (A)—plasma glucose profile during OGTT; Panel (B)—plasma glucose profile during IPTT; Panel (C)—area under the plasma glucose curve (AUC) for OGTT; Panel (D)—area under the plasma glucose curve (AUC) for IPTT. Values are mean ± SD (n = 6 per group); a—p < 0.05 vs. LFD; significance by t-test.

