Figure 5.
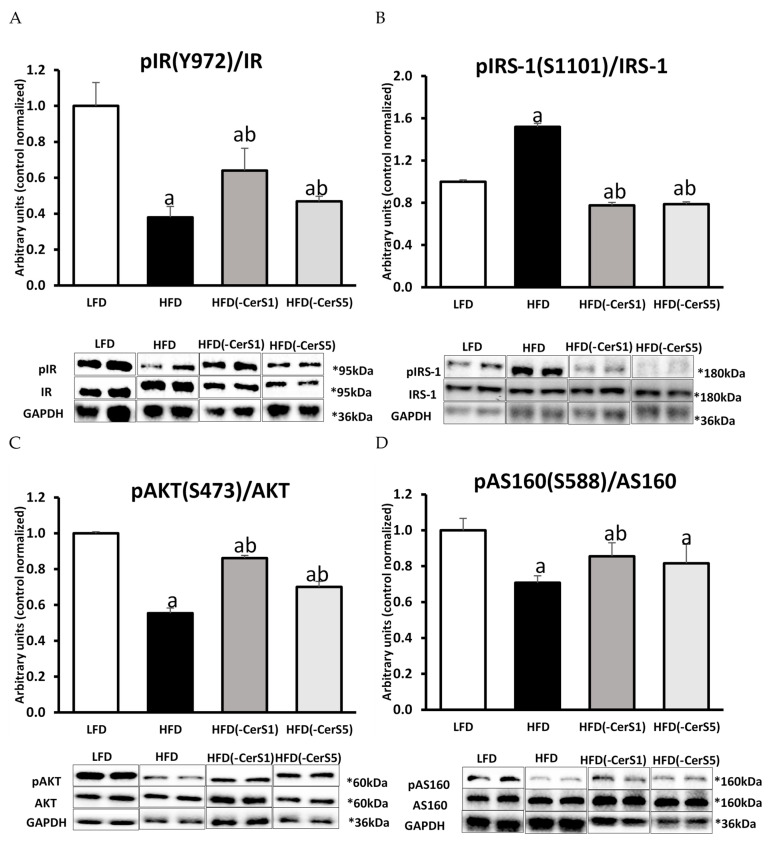
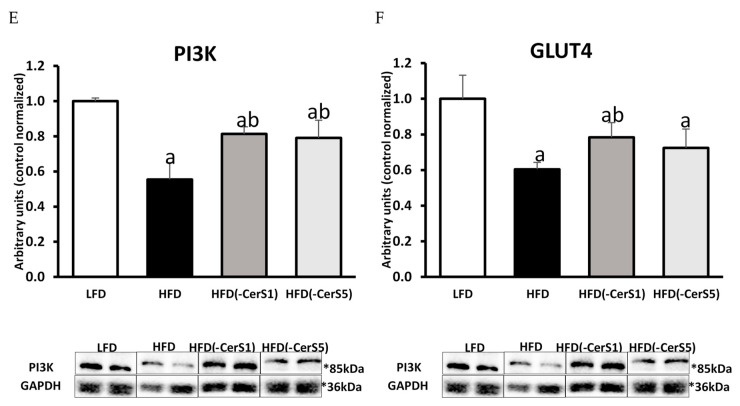
Activation of insulin signaling pathway in CerS1 and CerS5-silenced gastrocnemius muscle of HFD-fed mice: Panel (A)—insulin receptor tyrosine phosphorylation (pIR Y972); Panel (B)—IRS1 serine phosphorylation (pIRS S1101); Panel (C)—serine phosphorylation of protein kinase B/Akt (pAKT S473); Panel (D)—serine phosphorylation of Akt/PKB 160 kDa substrate (pAS160 S588); Panel (E)—protein expression of phosphoinositide 3-kinase (PI3K); Panel (F)—protein expression of glucotransporter 4 (GLUT4). Values are mean ± SD (n = 8 per group); a—p < 0.05 vs. LFD; b—p < 0.05 vs. HFD; significance by ANOVA; LFD-low-fat diet, HFD—high-fat diet. The observed molecular weight of indicated proteins is different to the theoretical one, as stated by the antibody manufacturer.


