Figure 3.
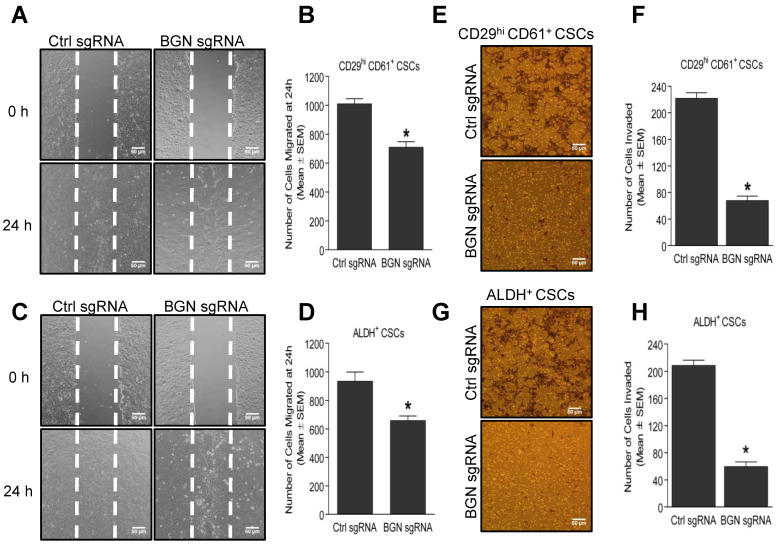
Loss of BGN reduces migration and invasion of BCSCs. (A) Representative images of wound healing assay showing migration of CD29hi CD61+ CSCs with BGN sgRNA compared to control sgRNA at 24 h, quantified in (B). (C) Representative images of wound healing assay showing migration of ALDH+ BCSCs with BGN sgRNA compared to control sgRNA at 24 h, quantified in (D). (E) Representative micrographs from a matrigel invasion assay depicting the number of invaded cells in CD29hi CD61+ BCSCs with BGN sgRNA compared to control sgRNA, quantified in (F). (G) Representative micrographs from invasion assay depicting the number of invaded cells in BGN sgRNA ALDH+ BCSCs, quantified in (H). Scale bar = 50 µm. Data shown as mean ± SEM of three independent experiments, p ≤ 0.05 (t-test) as compared to * control sgRNA group. Representative images of migration and invasion were quantified using ImageJ.

