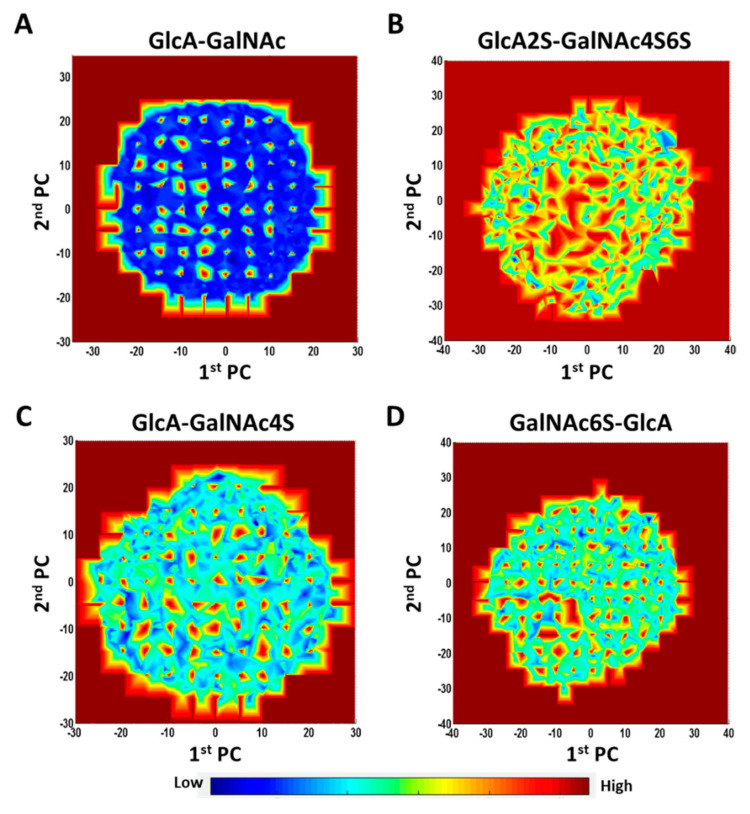
Figure 6.
Inherent potential energy landscape of CS disaccharides. Representative landscapes are shown for GlcA-GalNAc (A), GlcA2S-GalNAc4S6S (B), GlcA-GalNAc4S (C) and GalNAc6S-GlcA (D). The 2D-contour plots were prepared by projecting the respective potential energy values of the Z axis to the X and Y axes, where the X and Y-axes are the first two principal components (PCs) derived from principal component analysis (PCA) of the MD trajectory representing the conformational subspace. (see Figures S15 and S16 for other disaccharides).

