Figure 6.
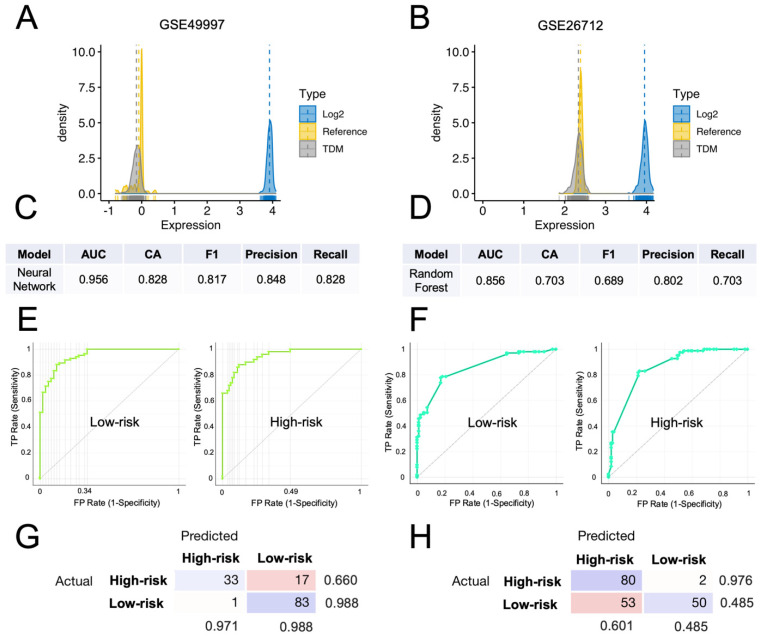
External validation of the computational classification of the HGSOC-TMI risk group. (A,B) Density plots of the TDM and log2-transformed training data (TCGA) against the validation datasets (GSE49997 and GSE26712). (C) Results of the neural-network model, which had the best score in the classification of the risk groups in the GSE49997 dataset. (D) Results of the random-forest model, that had the best score in the classification of the risk groups in the GSE26712 dataset. (E) Receiver operating characteristic (ROC) curves for two HGSOC-TMI risk groups for the GSE49997 and (F) GSE26712 datasets. (G,H) Confusion matrixes showing the number of patients correctly classified by using the best predictive model for each dataset.

