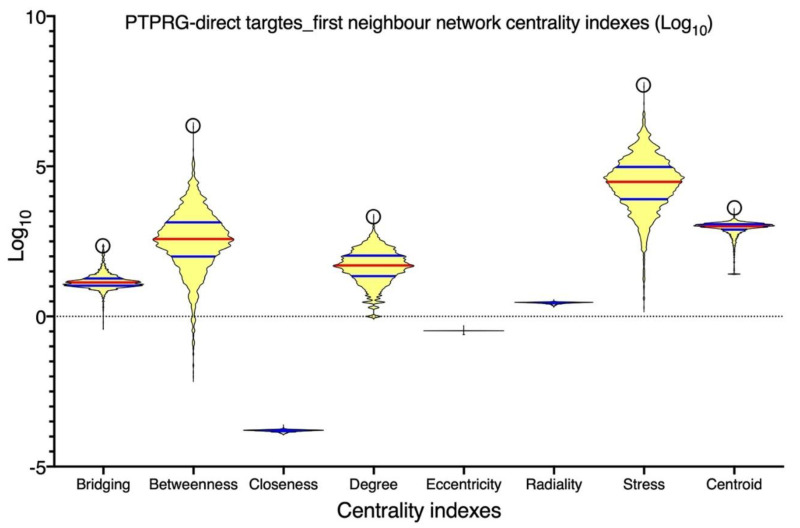
Figure 2.
Node centrality indexes computational analysis of the first neighbor’s protein–protein interaction (PPI) network inferred upon the eight known PTPRG direct targets: JAK2, BTK, ABL1, AXL, CTNNB1, BCR, EGFR, and FGFR1. Shown are violin plots of the statistical distribution of the values of the different node centrality indexes calculated for every node (2976 nodes, connected by 123,961 non-redundant, un-directed edges). To allow direct comparison, the log10 for every value was calculated. The upper open circle indicates the position of PTPRG. Red lines are medians, blue lines are quartiles.

