Figure 1.
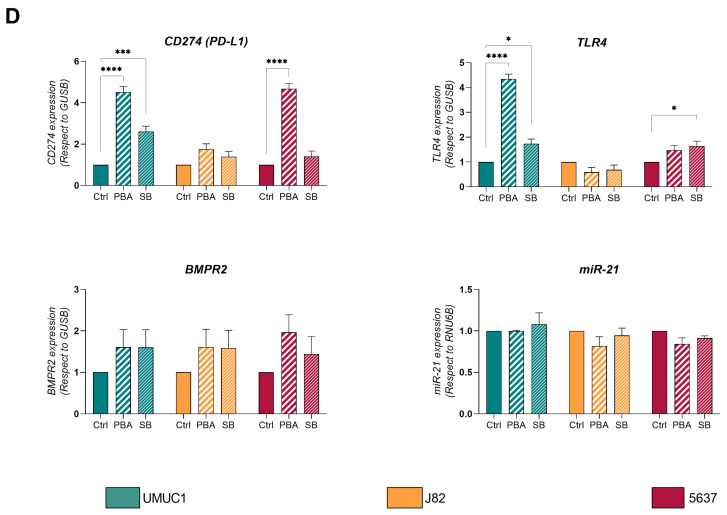
Effect of PBA and SB treatment on BC cell lines UMUC1, 5637 and J82. (A) Cell cycle phase percentage of UMUC1, J82 and 5637 BC cells without treatment (Ctrl) and after treatment with increasing concentrations of PBA and SB. Each bar corresponds to UMUC1, J82 and 5637 BC cells without treatment (Ctrl) and after treatment with PBA and SB as shown. (B) Immunoblot showing the expression of histone 3 and 4 acetylation in UMUC1, J82 and 5637 BC cells without treatment (Ctrl) and after treatment with PBA and SB. Quantification levels of all marks in the same cells are also shown. Total H3 and H4 were used for loading normalization. (C) Gene expression quantification by qPCR of cell-cycle-related genes p21 (CDKN1A), p27 (CDKN1B), MYC and E2F1. (D) Gene expression of molecules related to tumour–cell interaction such as CD274, TLR4, BMPR2 and miR-21. Expression of coding genes was normalized with respect to GUSB and miR-21 with respect to RNU6. Significance is depicted as follows: * p ≤ 0.05, ** p ≤ 0.01, *** p ≤ 0.001, **** p ≤ 0.0001.


