Figure 4.
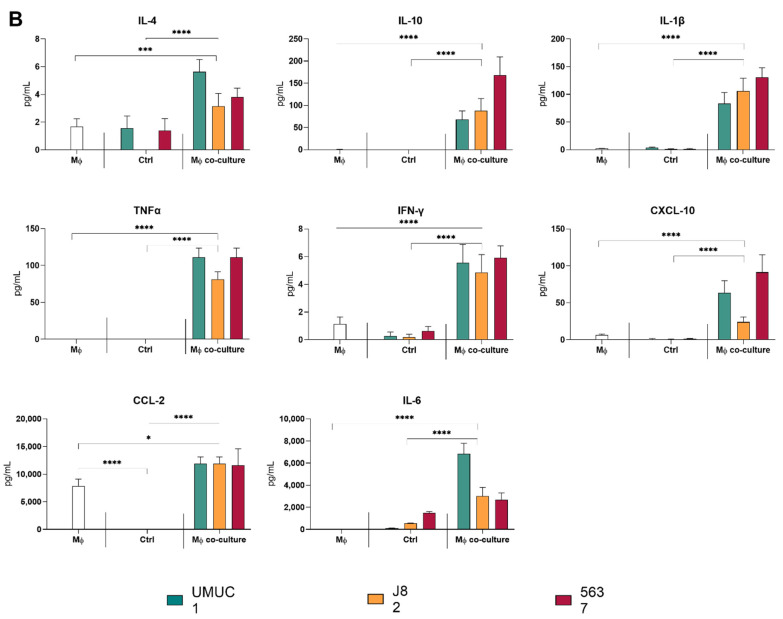
THC showed an enrichment in pluripotency factors compared with parental cells. (A) PD-L1 surface expression and MYC, SOX2 and NANOG gene expression in the assayed cell populations. PD-L1 surface expression is represented as the percentage of cells expressing PD-L1 on their surface. MYC, SOX2 and NANOG gene expression is shown relative to housekeeping GUSB gene expression. (B) Evaluation of cytokine expression profiles characteristic for M1 or M2 macrophage polarization in co-culture supernatants. IL-4, IL-10, IL-1β, TNFα and IFN-γ cytokine expression profiles are shown for single culture and co-culture supernatants. Supernatants of macrophages and BC cells single cultures were included as a control. Significance is depicted as follows: * p ≤ 0.05, ** p ≤ 0.01, *** p ≤ 0.001, **** p ≤ 0.0001.


