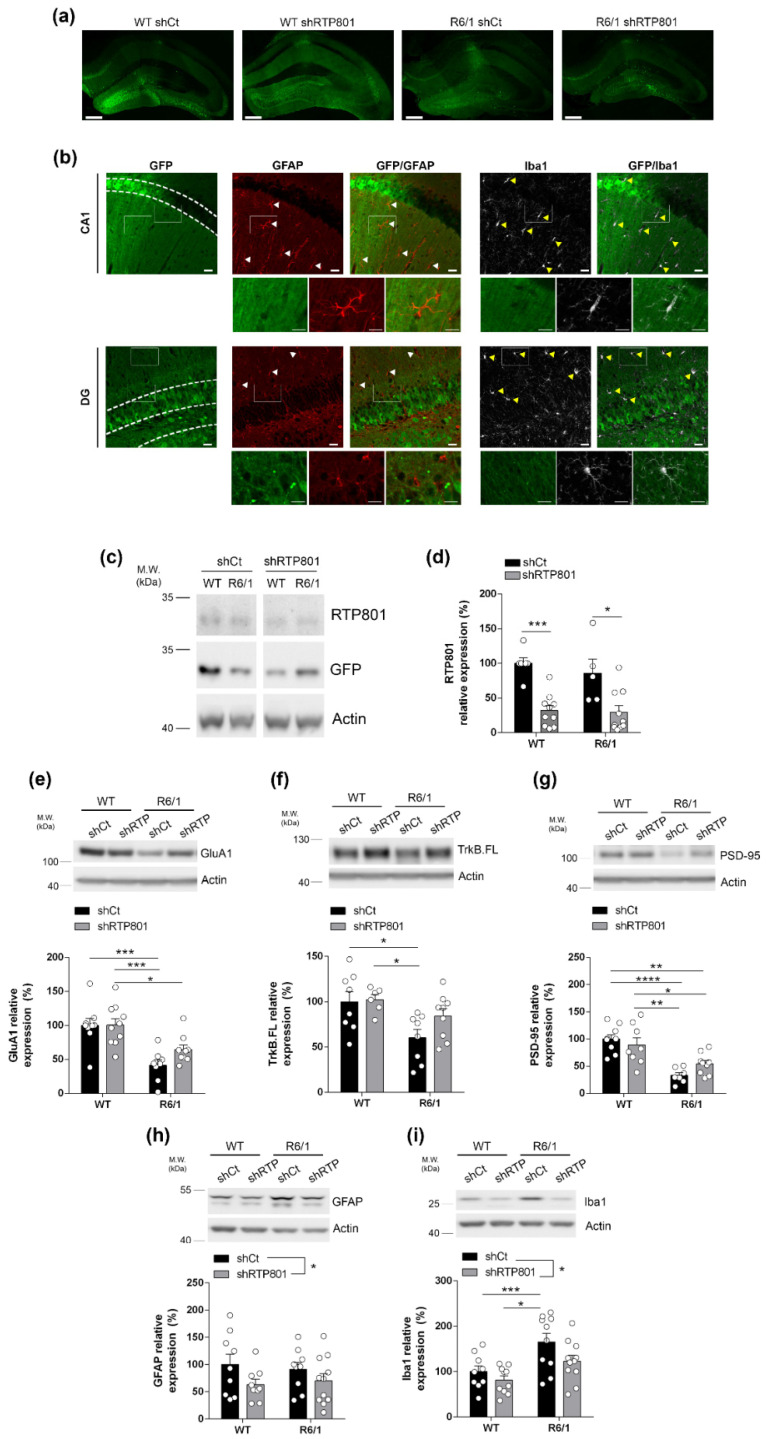
Figure 3.
RTP801 hippocampal silencing is restricted to principal neurons, partially restores synaptic GluA1 and TrkB.FL levels, and reduces neuroinflammatory markers in the R6/1 mouse. (a) Representative dorsal hippocampi from WT shCt, WT shRTP801, R6/1 shCt, and R6/1 shRTP801 mice 11 weeks after the injection; GFP fluorescence (green) was detected in the entire dorsal hippocampus. Scale bars, 250 µm. (b) Neither astrocytes (stained against GFAP, red) nor microglial cells (Iba1 + cells, grey) express GFP protein, indicating they were not transduced with AAV particles. CA1 and DG are depicted through dashed lines. Arrowheads indicate non-transduced glial cells. White rectangles in upper panels show digitally zoomed images (lower panels) to depict specific cells. Scale bars, 50 and 15 µm. (c) Representative immunoblot showing the levels of RTP801 relativized with respect to GFP/actin ratio levels as the corresponding loading controls in dorsal hippocampus extracts. (d) The histogram represents protein levels expressed as percentage of WT shCt (treatment effect: F(1, 27) = 31.18, p < 0.0001; genotype effect: F(1, 27) = 0.5064, p = 0.4828). (e–g) Representative immunoblots showing the levels of GluA1 (treatment effect: F(1, 32) = 1.771, p = 0.1927; genotype effect: F(1, 32) = 27.79, p < 0.0001), TrkB.FL (treatment effect: F(1, 27) = 1.954, p = 0.1736; genotype effect: F(1, 27) = 9.614, p = 0.0045) and PSD-95 (treatment effect: F(1, 29) = 0.3480, p = 0.5598; genotype effect: F(1, 29) = 32.94, p < 0.0001) normalized by actin in the crude synaptosomal fraction obtained from dorsal hippocampus extracts from WT shCt, WT shRTP801, R6/1 shCt, and R6/1 shRTP801 groups of mice. (h,i) Representative immunoblots showing the levels of GFAP (treatment effect: F(1, 34) = 4.222, p = 0.0477; genotype effect: F(1, 34) = 0.004228, p = 0.9485) and Iba1 (treatment effect: F(1, 36) = 4.691, p = 0.0370; genotype effect: F(1, 36) = 14.22, p = 0.006) normalized by actin in total homogenates obtained from dorsal hippocampus extracts from WT shCt, WT shRTP801, R6/1 shCt, and R6/1 shRTP801 groups of mice. Data are means ± SEM and were analyzed by two-way ANOVA followed by Bonferroni’s post hoc test. * p < 0.05, ** p < 0.01, and *** p < 0.001, **** p < 0.0001 compared with WT shCt.

