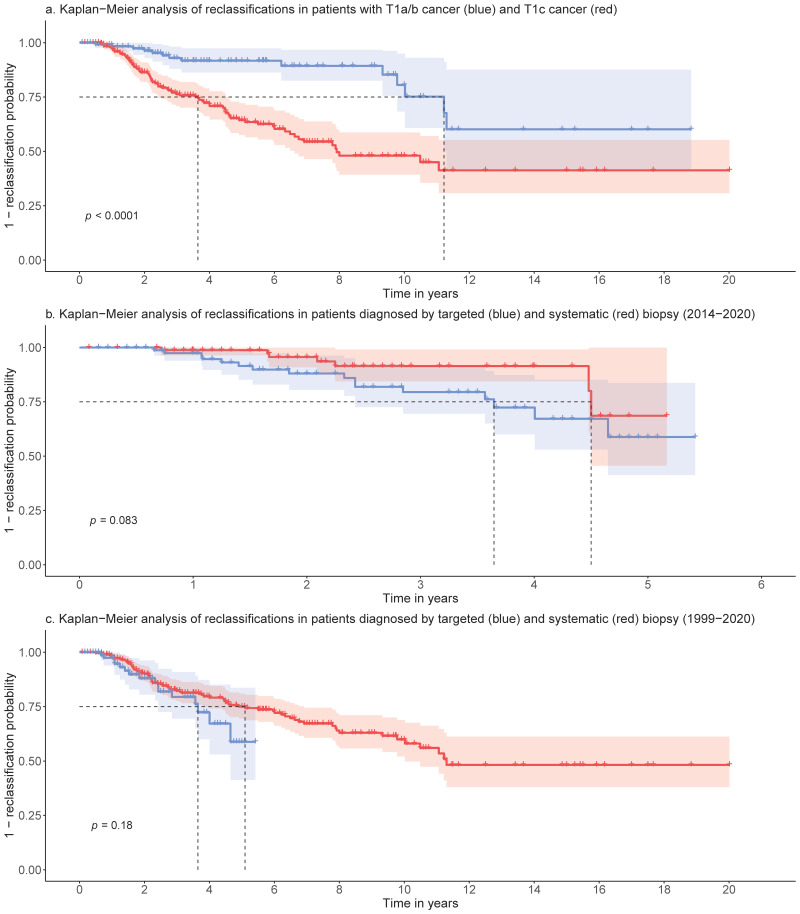
Figure 3.
(a): Kaplan–Meier analysis of reclassifications in patients with T1a/b cancer (blue) and T1c cancer (red): 25% of the patients are reclassified within 3.6y (T1c) and 11.2y (T1a/b). A total of 95% CI in light blue and light red, (b): Kaplan–Meier analysis of reclassifications in patients diagnosed by targeted (blue) and systematic (red) biopsy using the data from 2014–2020: 25% of the patients are reclassified within 3.6y (targeted) and 4.5y (systematic) (c): Kaplan–Meier analysis of reclassifications in patients diagnosed by targeted (blue) and systematic (red) biopsy using the data from 1999–2020.

