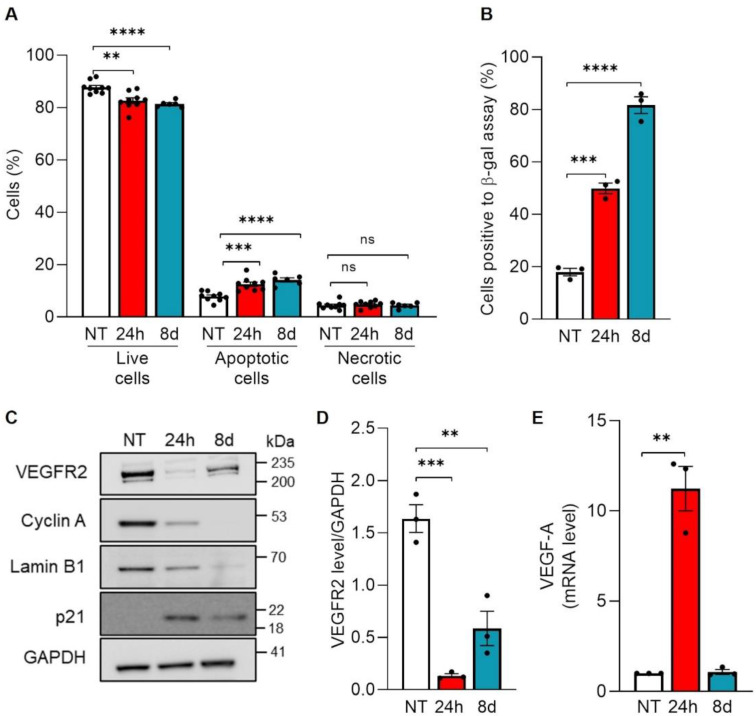
Figure 1.
Effects of a transient exposure of endothelial cells to Doxorubicin. HUVECs were incubated with 250 nM Doxorubicin for 24 h. After extensive washing, the medium was replaced with free-drug complete medium and cells were maintained in culture for additional days. Samples were collected and analyzed at 24 h of treatment (24 h), red histogram, and after 8 days (8 d), blue histogram. NT = not treated cells, white histogram. (A) Percentage of live, apoptotic, and necrotic cells determined by cytofluorimetry. Data are shown as mean ± SEM of n = 6–9 independent experiments per condition. ns p >0.05, ** p < 0.01 *** p < 0.001, **** p < 0.0001 by unpaired Student’s t test. (B) Percentage of positive cells for Senescence-Associated β-galactosidase activity. Data are shown as mean ± SEM of n = 3 experiments per condition; *** p < 0.001, **** p < 0.0001 by unpaired Student’s t test. (C) Cell lysates analyzed by immunoblotting with the indicated antibodies. (D) Quantification of VEGFR2 protein level by densitometric analysis. Data are shown as mean ± SEM of protein level normalized to GAPDH. n = 3 independent experiments; ** p < 0.01, *** p < 0.001 by unpaired Student’s t test. (E) mRNA level of VEGF-A determined by qRT-PCR. Each sample was normalized to β-tubulin and data are expressed as fold increase compared to the untreated sample. Data are shown as mean ± SEM of n = 3 independent experiments per condition. ** p < 0.01.

