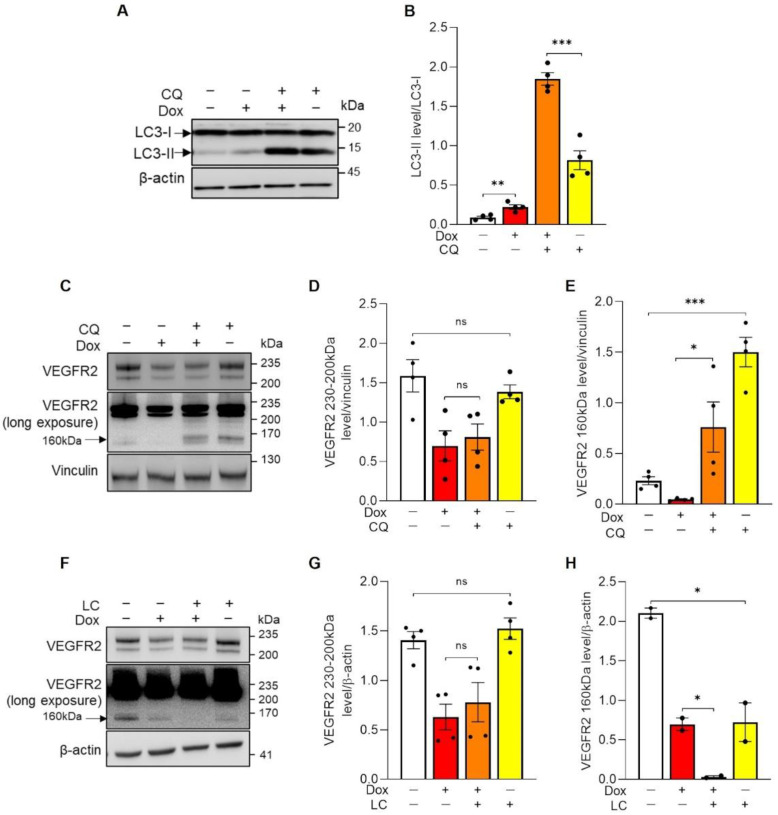
Figure 3.
Doxorubicin-induced VEGFR2 reduction is not due to an increased degradation. (A–E) HUVECs were incubated with 250 nM Doxorubicin in absence or presence of 50 µM Chloroquine (CQ). After 16 h, cells were lysed and analyzed by immunoblotting with indicated antibodies. (A) Representative immunoblot. Arrows indicate the LC3-II and LC3-I forms. (B) Quantification of LC3 protein level by densitometric analysis. Data are shown as mean ± SEM of LC3-II level normalized to LC3-I. n = 4 independent experiments per condition. ** p < 0.01, *** p < 0.001 by unpaired Student’s t test. (C) Representative immunoblot. Arrow indicates the cleaved form of VEGFR2 in the same long-exposed blot. (D,E) Quantification of the mature (VEGFR2 230–200 kDa) and cleaved VEGFR2 (VEGFR2 160 kDa) protein levels by densitometric analysis. Data are shown as mean ± SEM of protein level normalized to vinculin. n = 4 independent experiments per condition. ns p > 0,05, * p < 0.05, *** p < 0.001 by unpaired Student’s t test. (F–H) HUVECs were incubated with 250 nM Doxorubicin in absence or presence of 5 µM Lactacystin (LC). After 16 h, cells were lysed and analyzed by immunoblotting with indicated antibodies. (F) Representative immunoblot. Arrow indicates the cleaved form of VEGFR2 in the same long-exposed blot. (G,H) Quantification of the mature (VEGFR2 230–200 kDa) and cleaved VEGFR2 (VEGFR2 160 kDa) forms by densitometric analysis. Data are shown as mean ± SEM of protein level normalized to β-actin. n = 2–4 independent experiments per condition. ns p > 0.05, * p < 0.05 by unpaired Student’s t test. Not treated cells = white histogram, Dox = red histogram, Dox + CQ/LC = orange histogram and CQ/LC = yellow histogram.

