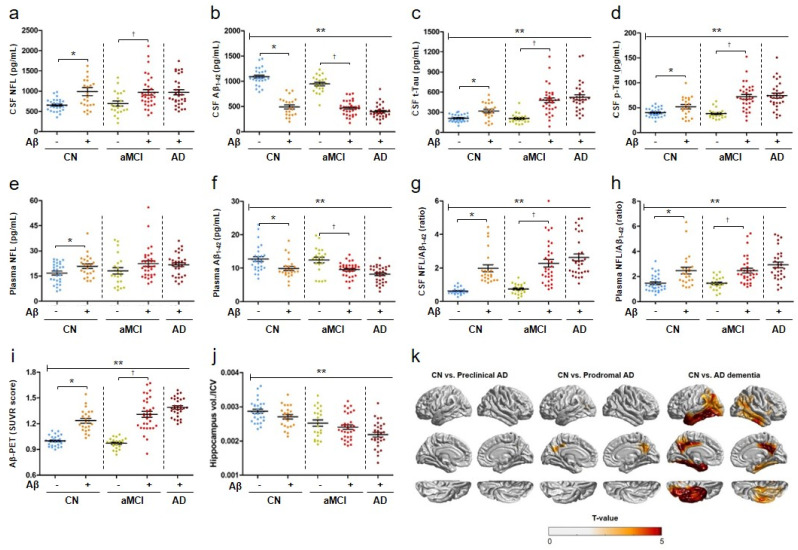
Figure 1.
Biomarker concentrations in the CSF, plasma, and neuroimaging data. Data are presented as mean values of ATN (amyloid, tau, and neurodegeneration) biomarker concentrations in the CSF (a–d), plasma neurofilament light chain (NFL) concentrations (e), plasma Aβ1–42 concentrations (f), CSF NFL/Aβ1–42 (g), plasma NFL/Aβ1–42 (h), standard uptake value ratio (SUVR) scores (i), and value of hippocampal volume/intracranial volume (ICV) (j). Statistical analysis was performed using SPSS version 25. ** p < 0.001, statically significant group effect by ANOVA [groups: cognitively normal (CN) (n = 51), amnestic mild cognitive impairment (aMCI) (n = 54), and Alzheimer’s disease (AD) dementia (n = 31)]. * p < 0.005, † p < 0.05, significant difference between two indicated groups using ANCOVA adjusted for age and sex. (k) Brain cortical atrophy patterns as t-value maps in the preclinical AD, prodromal AD, and AD dementia groups. Preclinical AD (CN Aβ+) (n = 23), prodromal AD (aMCI Aβ+) (n = 32), and AD dementia (AD Aβ+) (n = 30) groups were compared with the CN Aβ− (n = 28) group to observe differences in point-wise cortical thickness using a general linear model with adjustments for age, sex, and field strength as covariates. Greater cortical atrophy was observed in the AD dementia group.

