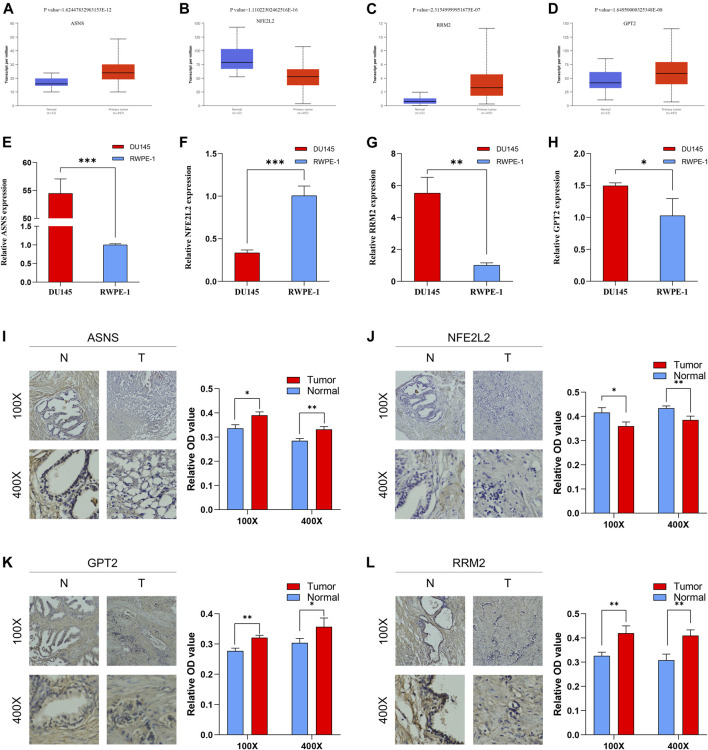
FIGURE 10.
The mRNA expression levels between PCa tissue and BPH tissue of ASNS (A), NFE2L2 (B), RRM2 (C) and GPT2 (D). The mRNA expression levels between PCa cells and normal prostatic epithelial cells of ASNS (E), NFE2L2 (F), RRM2 (G) and GPT2 (H). The protein expression levels between BPH tissue and PCa tissue of ASNS (I), NFE2L2 (J), GPT2 (K), RRM2 (L). *p < 0.05; **p < 0.01; ***p < 0.001.

