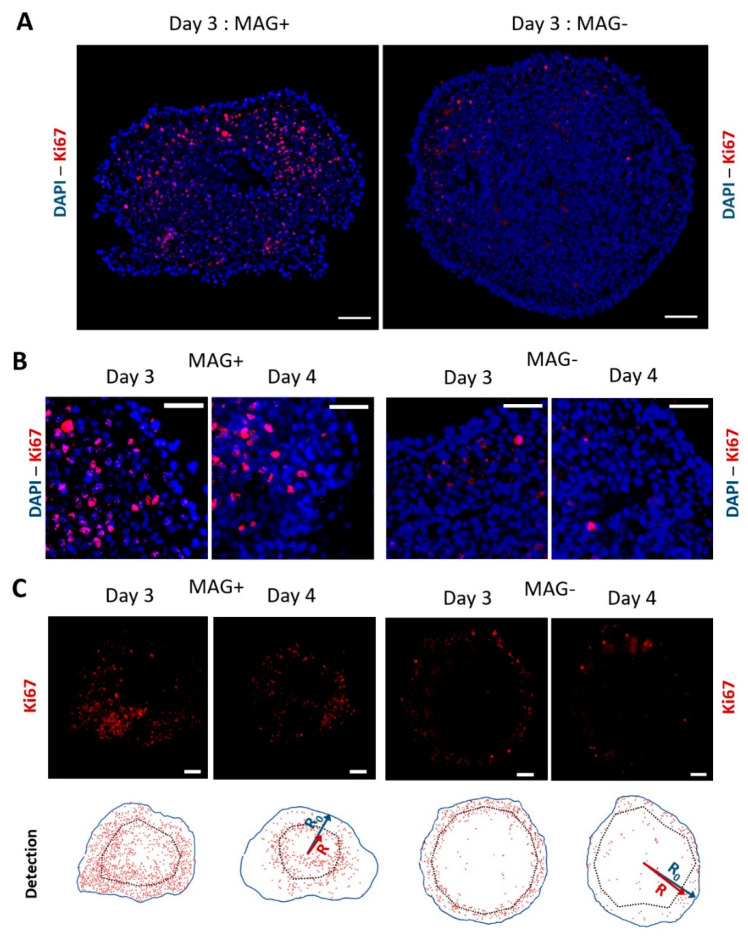
Figure 2.
Ki67 labeling and detection at day 3 and day 4 for MAG+ and MAG− spheroids. (A) Typical fluorescence staining of compressed (MAG+) or left free (MAG−) CT26 spheroids for two days. The nuclei are labeled in blue (DAPI), and the proliferation marker Ki67 is shown in red. The proliferative nuclei of the MAG− spheroids are located on the edges, whereas the images evidence proliferation toward the center of the MAG+ spheroid. Scale bar = 100 µm. (B) Close up images at the edges of MAG+ and MAG− spheroids cultured for two and three days after formation (day 3 and day 4, respectively). Nuclei are labeled in blue and Ki67 in red. Scale bar = 50 µm. (C) Other Ki67 fluorescence images (in red) at day 3 and day 4 for MAG+ and MAG− spheroids. The bottom analysis shows typical detection of the Ki67-positive nuclei for the different conditions. The red dots represent the Ki67-positive nuclei, the blue line the edges of the spheroid (distance from center R0), and the dashed line represents the average localization of the Ki67-positive nuclei (distance from center R) for each sample. Scale bar = 100 µm.

