Figure 4.
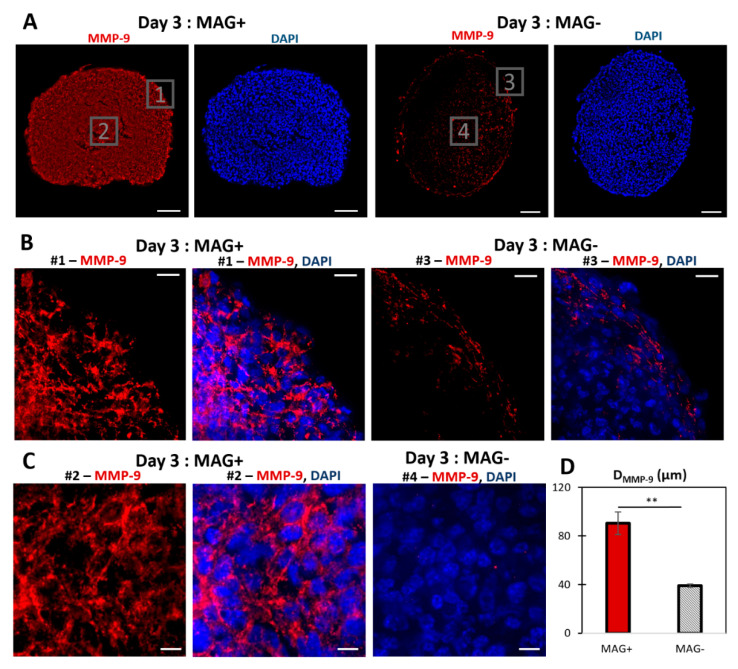
MMP−9 labeling of MAG+ and MAG− spheroids at day 3. (A) Typical fluorescent staining of MAG+ and MAG− spheroids cultured for two days after formation. MMP−9 is labeled in red, and the nuclei are labeled in blue (DAPI). For the MAG− spheroids, MMP−9 was mostly expressed at the edges. The MAG+ spheroids showed significant MMP−9 expression toward the center. Scale bar = 100 µm. (B) Close up images (# = number) at the edges of the spheroids: MMP−9 only (red) and merged images (MMP−9 in red, DAPI in blue). Scale bar = 20 µm. (C) Close up images for MAG+ (MMP−9 only in red and merged image with DAPI in blue) and MAG− spheroids (merged image of MMP−9 in red and DAPI in blue). Scale bar = 10 µm. (D) Localization of MMP−9 for the two conditions. The maximal radial MMP−9 localization, from the edges toward the spheroid center was quantified. The average MMP−9 depth was higher for the three-day MAG+ spheroids (red bar) than for the MAG− spheroids (striped bar), n = 2 and n = 3, respectively (** p < 0.001).

