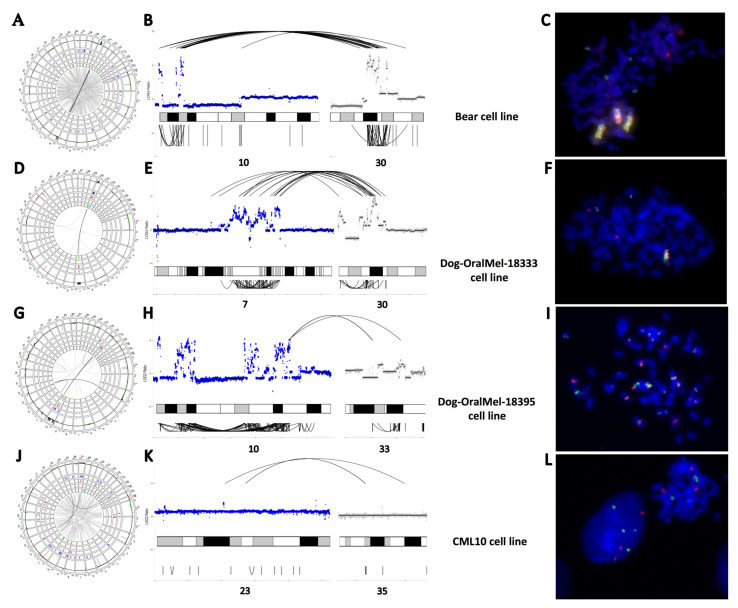
Figure 2.
Structural variants (SVs) of the four canine MM cell lines. (A–C) SVs identified through WGS in the cell line Bear. (A). Circos plot representing the distribution of SVs along dog chromosomes with, from external to internal layers, CNA gains/losses (in dark red/green), deletions, duplications, insertions, and inversions in blue, light red, orange, and green, respectively. Interchromosomal break-ends (BND) are represented by gray lines connecting chromosomes with a color intensity corresponding to the number of reads validating the SV. (B). Focus on CFA 10 and CFA 30 present the focal amplifications and clusters of SVs (BND and INV). Copy numbers in log2ratio are represented as inter (top) and intra-chromosomal (bottom) SVs. (C). Fluorescence in situ hybridization (FISH) analysis of Bear cell line targeting CFA 10 (MDM2 region) and CFA 30 (TRPM7 region) in green and red, respectively, showing derivative chromosomes compatible with a chromothripsis-like event. (D–F). SVs of the cell line Dog-OralMel-18333. (D). Circos plot representing CNV, BND, DEL, and INV across the genome. (E). Focus on CFA 7 and CFA 30 presenting the focal amplifications and cluster of SVs (BND, DEL, DUP and INV). (F). FISH analysis of Dog-OralMel-18333 cell line targeting CFA 7 and CFA 30 (TRPM7 region) in green and red, respectively, showing derivative chromosomes compatible with a chromothripsis-like event. (G–I). SVs of the cell line Dog-OralMel-18395. (G). Circos plot representing CNV, BND, DEL, and INV across the genome. (H). Focus on CFA 10 and CFA 33 presenting the focal amplifications and cluster of SVs (BND, DEL, DUP, and INV). (I). FISH analysis of Dog-OralMel-18395 cell line targeting CFA 10 (MDM2 region) and CFA 10 (CDK4 region) in green and red, respectively, showing derivative chromosomes compatible with a chromothripsis-like event. (J–L). SVs of the cell line CML10. (J). Circos plot representing CNV, BND, DEL, and INV across the genome. (K). Focus on CFA 23 and CFA 35 presenting interchromosomal rearrangement. (L). FISH analysis of CML10 cell line targeting CFA 10 (MDM2 region) and CFA 30 (TRPM7 region) in green and red, respectively, showing 3 to 4 spots compatible with a tetraploid state without massive genomic rearrangements. Image (A,D,G,J) are available in the Supplementary Material (Figure A3, Figure A4, Figure A5 and Figure A6).

