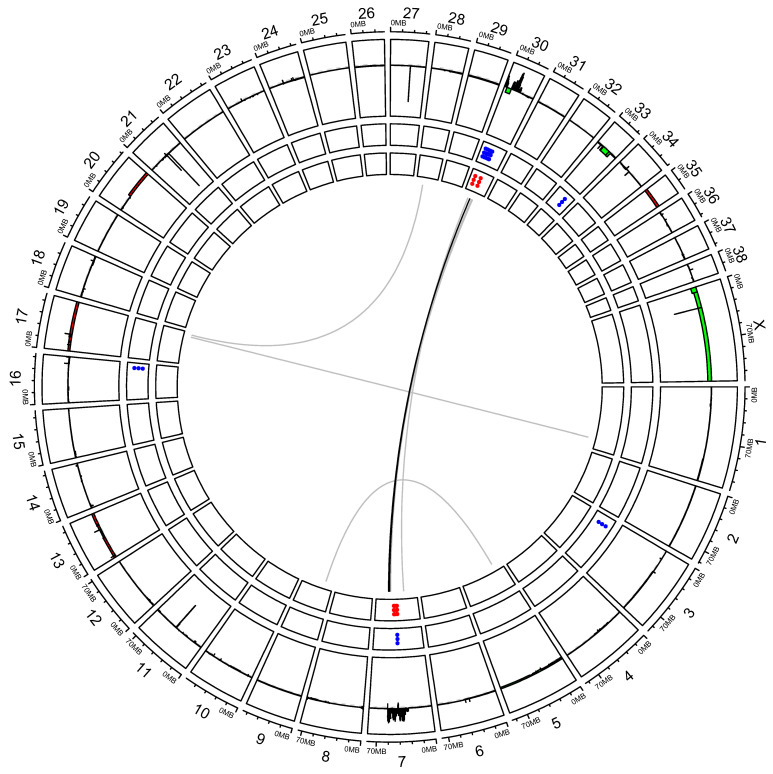
Figure A4.
Circos plot representing the distribution of SVs of Dog-OralMel-18333 cell line along dog chromosomes with, from external to internal layers, CNA gains/losses (in dark red/green), deletions, duplications, insertions, and inversions in blue, light red, orange, and green, respectively. Interchromosomal break-ends (BND) are represented by gray lines connecting chromosomes with a color intensity corresponding to the number of reads validating the SV.

