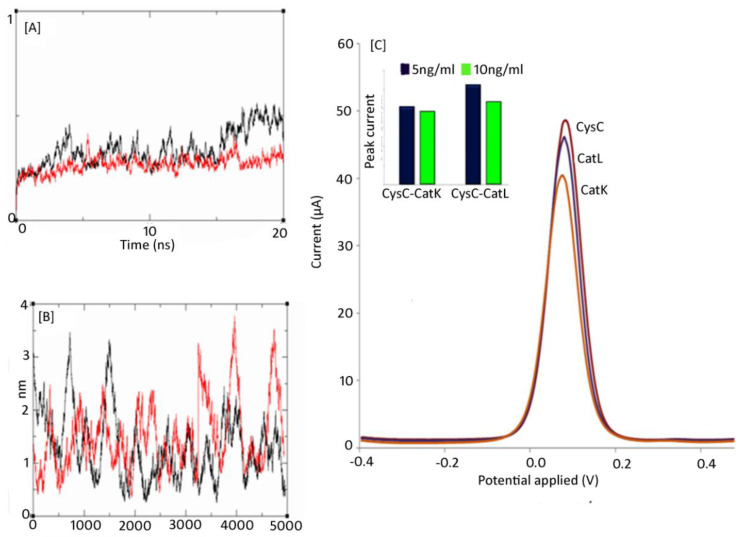
Figure 4.
(A) Protein RMSD is represented as a function of simulation time in black [CatL] and red [CatK] respectively. (B) The per residue RMSF has been represented as a function of the residue number in black [CatL] and red [CatK], respectively, (C) The DPV graphs of CysC in the presence of CatL and CatK on the multiwalled carbon nanotube based electrode (inset) Effect of changing concentration of CatL and CatK on peak current response.

