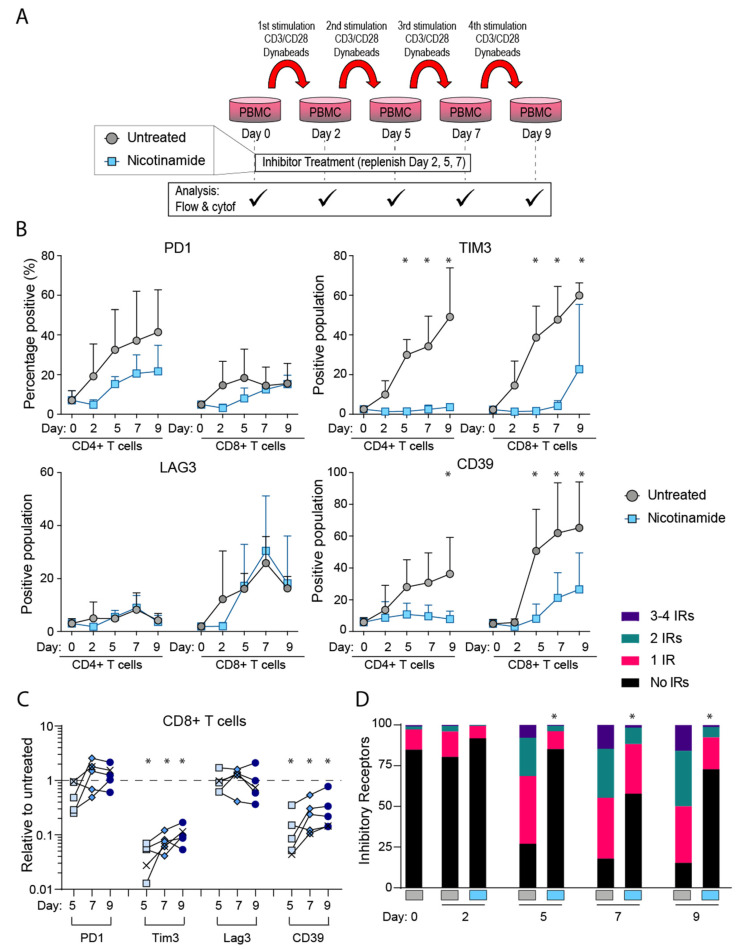
Figure 1.
Expression of IRs in vitro in the presence of NAM. NAM reduced expression of TIM3 and CD39. (A) Schematic showing experimental set up. (B) Time course shown for average across four flow cytometry experiments, with error bars indicating standard deviation, and statistical significance between treated and untreated indicated by * as determined using the Holm-Sidak method (α = 0.05). Additional statistics performed on (C) combined data when compared to untreated only for each time point, on days five to nine across n = 5 in vitro stimulation experiments, Mann-Whitney test (p < 0.05 indicated by *). (D) Cumulative IR expression of total CD8+ T cells as scored for representative experiment shown in 1A, chi-squared analysis (* p < 0.05). Data points marked in (C) as ‘X’ were obtained from mass cytometry analysis, with remainder from flow cytometry.

