Figure 7.
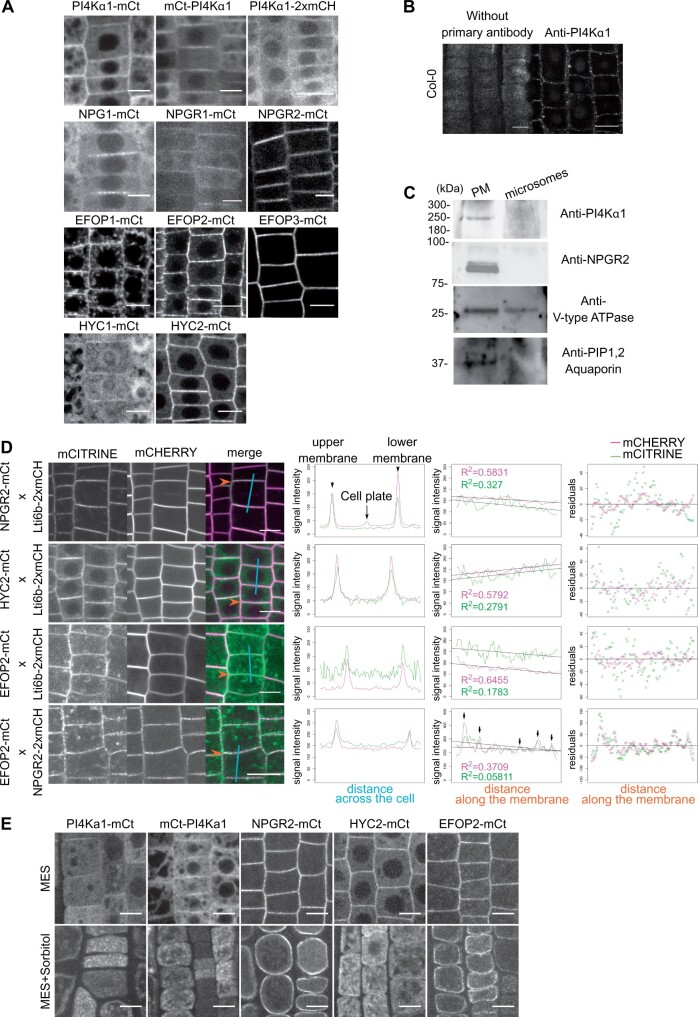
The PI4Kα1 complex localizes at the plasma membrane. A, Confocal images of PI4Kα1, NPG1, NPGR1, NPGR2, HYC1, HYC2, EFOP1, EFOP2, and EFOP3 fused to mCITRINE (mCt) or 2xmCHERRY under the control of the UBQ10 promoter in root epidermal cells. Scale bar: 10 µm. B, Confocal images of PI4Kα1 using an anti-PI4Kα1 antibody in epidermal root cells on WT seedlings. Control background without primary antibody is shown. Scale bar: 10 µm. C, Immunoblot using anti-PI4Kα1, anti-NPGR2, anti-V-type ATPase, and anti-PIP1,2 aquaporin antibodies on plasma membrane and microsomal fractions from WT seedlings. D, Confocal images of seedlings co-expressing Lti6b-2×mCHERRY (under the control of the 2×35S promoter), NPGR2–mCITRINE, HYC2–mCITRINE, or EFOP2–mCITRINE (under the control of the UBQ10 promoter). Graphics on the left represent intensity of each signal across the cell along the cyan line. Graphics in the middle represent intensity of each signal along the membrane indicated by the orange arrow. Matching pic intensity is indicated by black arrows. Linear regression and adjusted R square for each signal are indicated. Graphics on the right represent residuals in y between signal along the membrane and linear regression. E, Confocal images of PI4Kα1-mCt, mCt-PI4Kα1, NPGR2-mCt, HYC2-mCt, EFOP2-mCt under the control of the UBQ10 promoter in root epidermal cells in control condition (MES) and during plasmolysis (MES+Sorbitol). Scale bar: 10 µm.

