Figure 8.
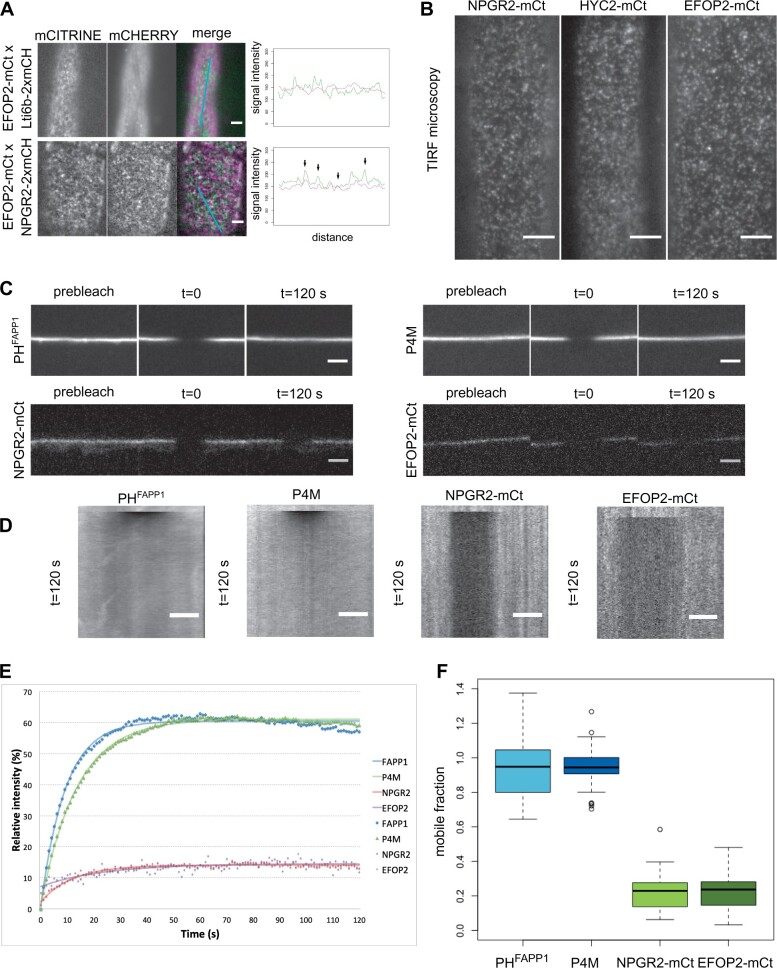
The PI4Kα1 complex localizes in highly static nanodomains at the plasma membrane. A, Confocal images of seedlings co-expressing Lti6b–2×mCHERRY (under the control of the 2x35S promoter), NPGR2–mCITRINE, or EFOP2–mCITRINE (under the control of the UBQ10 promoter). Graphics represent intensity of each signal across the cell along the cyan line. Black arrows indicate matching signals. Scale bar: 5 µm. B, Confocal images of TIRF microscopy of NPGR2-mCt, HYC2-mCt, and EFOP2-mCt. Scale bar: 5 µm. C, Confocal images of P4M, PHFAPP1, NPGR2-mCt, and EFOP2-mCt before photobleaching (prebleach) and 120 s after photobleaching. Scale bar: 5 µm. D, Kymographs along the membrane for the time lapse in (C). Scale bar: 5 µm. E, Graphic presenting the recovery of the signal intensity over time after bleaching. The number of zones measured is 37, 32, 30, and 13 for P4M, PHFAPP1, NPGR2-mCt, and EFOP2-mCt, respectively. The fitting curves are represented. F, Graphic presenting the mobile fraction of P4M, PHFAPP1, NPGR2-mCt, and EFOP2-mCt after 2 min post-bleaching taking in account the inherent bleaching due to imaging. Whiskers correspond to the lower and upper quartile, the median and the minimum and maximum (excluding the outliers), respectively.

