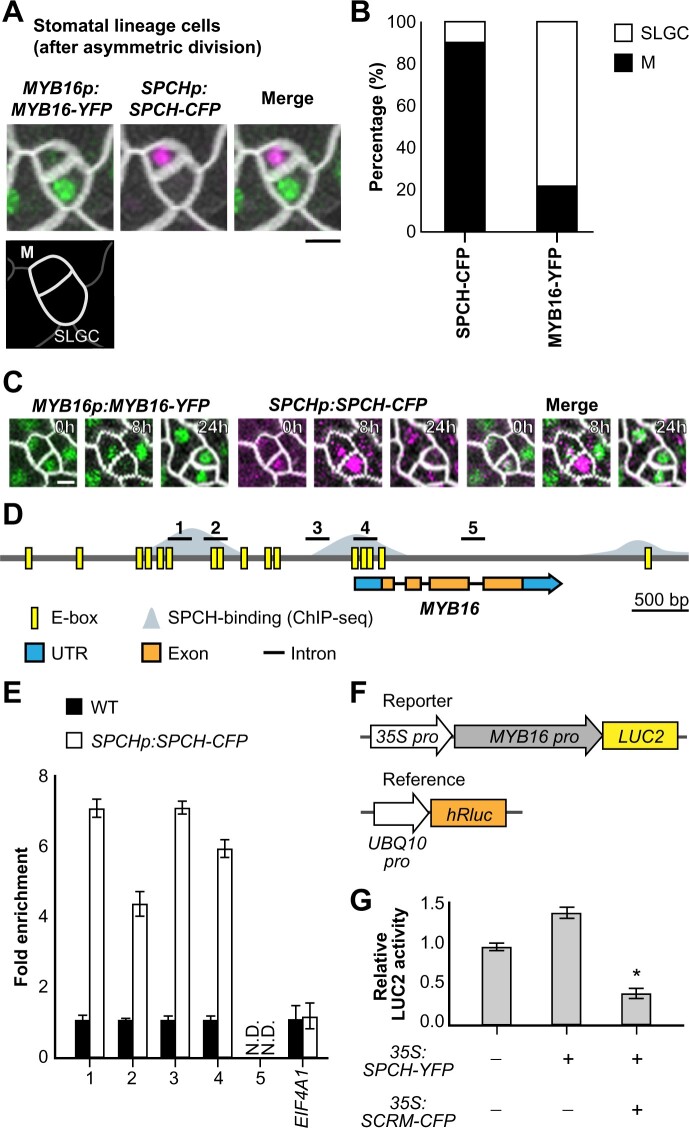
Figure 1.
SPCH binds to the MYB16 promoter and downregulates its expression in meristemoids. A, Still images of MYB16-YFP (green) and SPCH-CFP (magenta) in a meristemoid (M)–SLGC pair in a true leaf from a WT plant at 7 dpg. B, Frequency of SPCH or MYB16 in either cell of meristemoid–SLGC pairs. SPCH was often found in meristemoids, as predicted (89.6%). In contrast, MYB16 preferentially localized to SLGCs (78.4%). A whole leaf image was used to obtain 583 pairs. M, meristemoid. C, Time-lapse imaging of SPCH and MYB16 in a meristemoid–SLGC pair. Both SPCH and MYB16 were found in the meristemoid at 0 h, but only the SPCH signal remained at 8 h before asymmetric cell division (24 h). D, Diagram of the MYB16 genome region: E-boxes (CANNTG) predicted by PlantPAN 3.0 are shown in yellow, SPCH-binding sites obtained from SPCH ChIP-seq data (Lau et al., 2014) are shown in gray. Five regions (black bars) designed for the ChIP-qPCR assay were used in (E). E, SPCH binds to the MYB16 promoter, as revealed by ChIP-qPCR of 4 dpg SPCHp:SPCH-CFP seedlings with GFP-trap beads. Three biological replicates (independent experiments with the same experimental procedure) showed similar results. EIF4A1 is a negative control. N.D., not detected. Data are means (sd). F, The experimental design for the MYB16 luciferase assay. The MYB16 promoter was fused with a mini-35S promoter to enhance gene expression. Ratiometric luminescent reporters were used to normalize the expression difference in a given construct. G, SPCH functions with SCRM/ICE1 to downregulate MYB16 expression. The luciferase assay was performed with protoplasts from 3-week-old WT plants. Four biological replicates showed similar results. *P < 0.001, by Student’s t test. Data are means (sd). For (A) and (C), cell outlines are marked by RC12A-mCherry (gray). Scale bars, 5 µm. See also Supplemental Figures S1 and S2.

