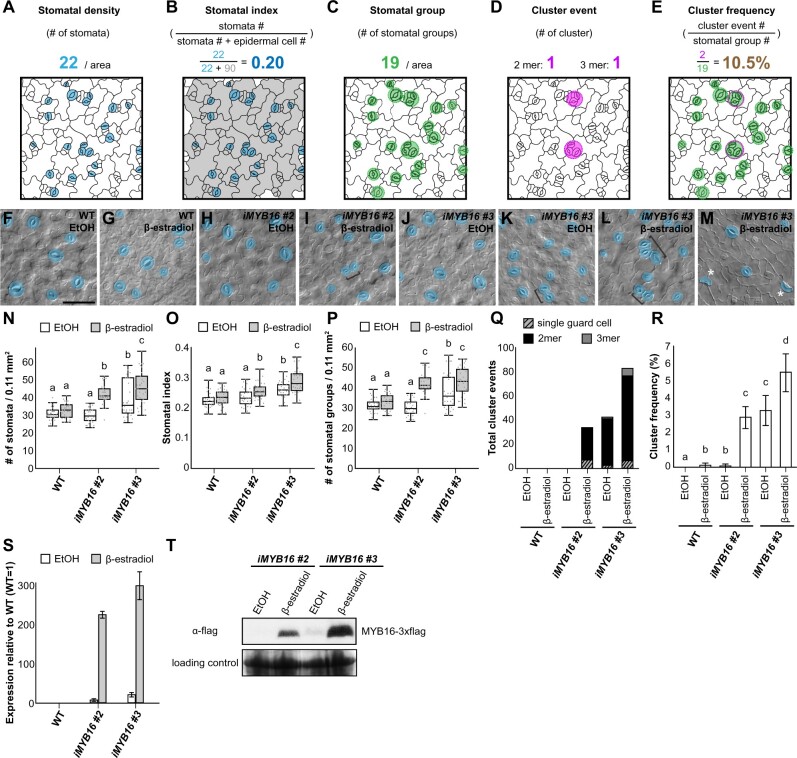
Figure 3.
Overexpression of MYB16 induces the formation of stomatal clusters. A, Stomatal density is defined by the total stomatal number in a given area. Mature stomata with pores are colored in blue. B, Stomatal index calculated by dividing the stomatal number by the total epidermal cell number (the sum of stomata, meristemoids, SLGCs, and pavement cells) in a given area, i.e. the number of blue cells divided by the number of blue and gray cells. C, Stomatal group is defined as a single stomatal island. Adjacent stomata are counted as one group. Groups are indicated by green circles. D, Cluster event represents the event number of stomatal pairs, triplets, or more than three adjacent stomata. Clusters are indicated by magenta circles. E, Cluster frequency calculated by dividing the number of cluster events by the number of stomatal groups, i.e. the number of magenta circles divided by the number of green circles. F–M, DIC images of the lower epidermis in 10-dpg WT true leaves and two MYB16 inducible lines (iMYB16#2 and #3) treated with EtOH (mock) or 50-µM β-estradiol. Stomatal pairs (brackets) were often found after β-estradiol treatment in the MYB16 induced lines. Occasionally, single GCs (asterisks) were found (M). Mature GCs are pseudo-colored in blue. Scale bar, 50 µm. N, Quantification of stomatal density (number of pores per 0.11 mm2) from (F) to (M). Stomatal density increased after β-estradiol treatment in the iMYB16 lines. Compared to iMYB16#2, iMYB16#3 had a higher stomatal number under mock treatment, which suggests leaky expression of MYB16. O, Quantification of stomatal index (the number of stomata divided by the total number of epidermal cells) from (F) to (M). Stomatal index increased after β-estradiol treatment in iMYB16 lines. P, Quantification of the number of stomatal groups (cluster as a single complex) per 0.11 mm2 from (F) to (M). The number of stomatal groups increased after β-estradiol treatment in iMYB16 lines. Q, Quantification of abnormal stomatal phenotypes shows that iMYB16 lines had more single GC and stomatal clusters (2–3 mer) than WT plants after β-estradiol treatment. Data are the sum of event numbers of 30 lower epidermis samples. R, Quantification of cluster frequency shows that stomatal clusters formed more frequently in iMYB16 than WT plants after β-estradiol treatment. Data are the means (se) of 30 lower epidermis samples. S, The expression of MYB16 was induced more than 200-fold after β-estradiol treatment, as revealed by qRT-PCR. iMYB16#3 (23.5×) was expressed at a higher level than iMYB16#2 (7.3×) under mock conditions. Data are means (sd). T, Immunoblot analysis indicating that MYB16 protein levels are tightly controlled in iMYB16#2. iMYB16#3 had leaky MYB16 expression under mock conditions, which could explain the phenotypes observed in (K). Coomassie blue staining of total protein represents a loading control. Thirty lower epidermis samples were used in (N)–(R). For (N)–(R), three biological replicates showed similar results. P < 0.05, Kruskal–Wallis test with Dunn’s test (N)–(P), P < 0.05. One-way ANOVA with Tukey post hoc test (R). Medians and interquartile ranges are shown in (N)–(P).

