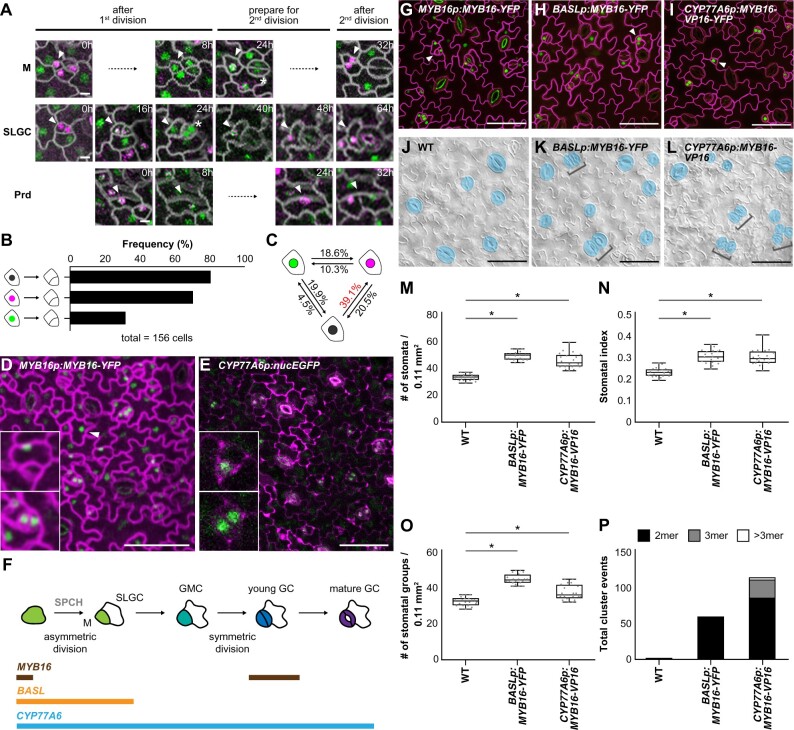
Figure 4.
Ectopic expression of MYB16 in early stomatal lineage cells causes stomatal cluster formation. A, Time-lapse confocal images of MYB16-YFP (green) and SPCH-CFP (magenta) in 7-dpg true leaves show that SPCH and MYB16 were expressed individually or together, depending on the sequence of cell division. Arrowheads indicate cells of interest. An asterisk shows MYB16-YFP in the pair of GCs. Timestamps indicate the time since the start of the first cell division. M, meristemoid; Prd, protoderm. B, Results from sequential pattern analysis of protein expression using the PrefixSpan algorithm. The colocalization (black) and SPCH alone (magenta) were more frequently seen than MYB16 alone (green) before cell division. A total of 156 serial events were collected from time-lapse confocal images of 7-dpg true leaves for sequential pattern analysis. C, Frequency of the state transition between SPCH alone, MYB16 alone, and colocalization using the PrefixSpan algorithm. The state transition from colocalization (black) to SPCH alone (magenta) had the highest frequency (39.1%). D, MYB16-YFP driven by the MYB16 promoter in an 8-dpg true leaf. Confocal image shows that MYB16 expression is limited to SLGCs (upper inset), young GCs (lower inset), and pavement cells (arrowhead). E, Confocal image of the CYP77A6 transcriptional reporter in an 8-dpg true leaf shows that CYP77A6 expression is stomatal lineage-specific, as seen in meristemoid (upper inset) and pairs of GCs (lower inset). Seven individual T1 lines were characterized and showed similar results. F, Summarized expression window of the MYB16, BASL, and CYP77A6 promoters. M, meristemoid. G–I, Confocal images of 10-dpg true leaves. MYB16-YFP was driven by the MYB16 (G), BASL (H), or CYP77A6 (I) promoter. Rather than being preferentially localized to SLGCs in the MYB16 native promoter lines (G), BASL (H), and CYP77A6 (I) promoter-driven MYB16 signals were seen in meristemoid cells (arrowheads). J–L, DIC images of the lower epidermis from 10-dpg true leaves of the WT (J), BASLp:MYB16-YFP (K), and CYP77A6p:MYB16-VP16 (L) lines. Stomatal clusters (brackets) were found in BASLp and CYP77A6p lines. Mature GCs are pseudo-colored in blue. M–O, Quantification of stomatal density (M), stomatal index (N), and the number of stomatal groups (O). All parameters increased when MYB16 was ectopically expressed in early stomatal lineage cells. n = 20 seedlings. *P < 0.05, by Wilcoxon signed-rank test. Data are medians (interquartile range). P, Total cluster events show that ectopically expressing MYB16 in stomatal lineage causes stomatal cluster formation. The values were obtained from the sum of the events from 20 lower-epidermis samples. Cell outlines are marked either by ML1p:RC12A-mCherry in (A), (D), and (G) to (I) (gray in (A), magenta in (D) and (G)–(I)) or stained by PI in (E). Scale bars, 5 µm in (A) and 50 µm in (D), (E), and (G)–(L). For (M)–(P), three biological replicates showed similar results. See also Supplemental Figures S3–S7.

