Figure 6.
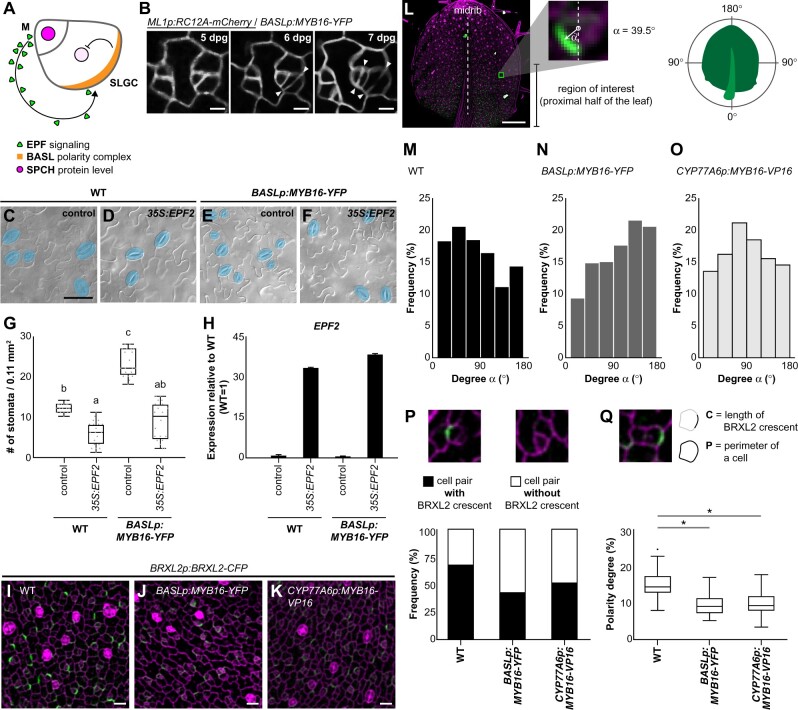
Stomatal cluster formation is caused by the mis-localization and reduced amounts of polarity protein in the stomatal lineage. A, Diagram shows the EPF-mediated inhibitory pathway incorporating the spatially labeled polarity complex to prevent stomatal cluster formation in Arabidopsis. EPFs are secreted from meristemoid (M) cells and activate inhibitory signaling in SLGCs, where the polarity complex recruits inhibitory components, leading to decreased SPCH levels. B, Time-lapse confocal images show stomatal cluster formation in the BASL promoter-driven ectopic MYB16 line. Left parts of the images show normal stomatal formation. Right parts show that the adjacent stomate is derived from an SLGC, resulting in stomatal clustering. Arrowheads indicate divisions. C–F, DIC images of the lower epidermis from 14-dpg cotyledons of the WT or BASLp-driven MYB16 lines with or without the overexpression of EPF2. Mature stomata are pseudo-colored in blue. Scale bar, 50 µm. G, Quantification of stomatal density showing that the overexpression of EPF2 reduces the number of stomata in both WT and BASLp:MYB16-YFP. n = 20 14-dpg plants. P < 0.001, by Kruskal–Wallis test with Dunn’s method. Data are medians (interquartile range). H, qRT-PCR analysis of relative mRNA level of EPF2 in 14-dpg cotyledons. EPF2 was highly expressed in plants with the 35S:EPF2 construct. Data are means (sd). I–K, Confocal images of the polarity marker BRXL2 in 7-dpg true leaves. Compared to the WT (I), BRXL2-CFP signal (green) is dimmer in BASLp:MYB16-YFP (J) and CYP77A6p:MYB16-VP16 (K). Four individual lines of each background showed similar results. L, Angle α indicating the angle between the vectors of the midrib and BRXL2. The vector toward the proximal part of a 7-dpg true leaves is set to 0°. α angles were measured in the bases of leaves. M–O, The orientation of polarity in the WT (M), BASLp:MYB16-YFP (N), and CYP77A6p:MYB16-VP16 (O). To avoid the PI effect, α angles were quantified from confocal images of 7-dpg true leaves expressing BRXL2 in the indicated lines without PI staining. n = 769, 324, and 615 cells in (M–O), respectively. P, The proportion of cells with BRXL2 crescents is reduced in ectopic MYB16 lines compared to the WT. n = 227, 150, and 217 cell pairs in the WT, BASLp:MYB16-YFP, and CYP77A6p:MYB16-VP16, respectively. Q, Analysis of the polarity degree of BRXL2 crescents shows that ectopic MYB16 lines have a lower polarity degree compared to the WT. Polarity degree is calculated from crescent length divided by cell perimeter. The dataset is derived from 67 cells with peripheral BRXL2 for each line. The dot shows the Tukey outlier. *P < 0.001, by Student’s t test. Data are medians (interquartile range). Cell outline marked by ML1p:RC12A-mCherry in (B, gray) and labeled by PI in (I)–(K), (P), and (Q) (magenta). Scale bars, 5 µm in (B), 20 µm in (I)–(K), and 200 µm in (L). For (M)–(Q), data combined from four individual lines of each background. See also Supplemental Figures S11 and S12.

