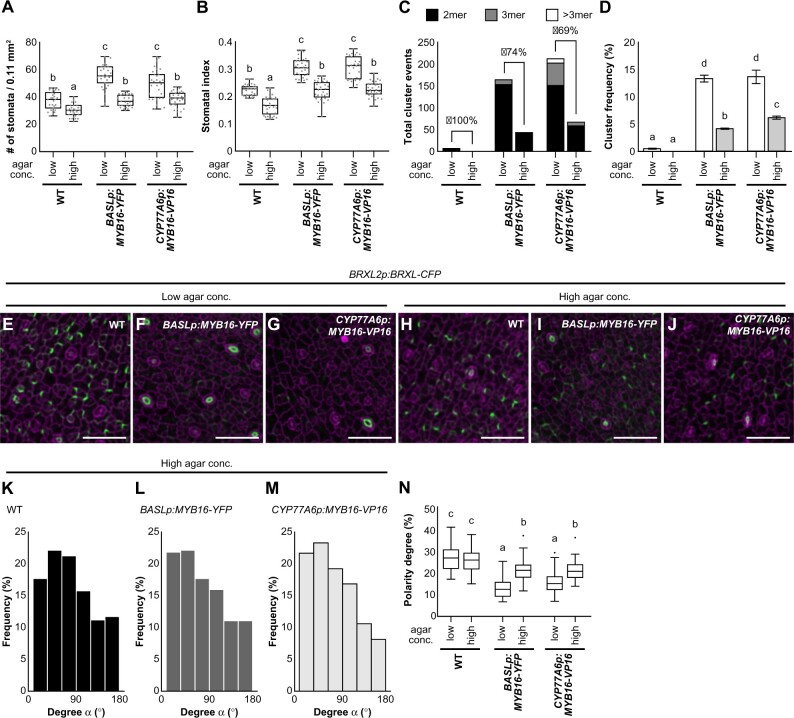
Figure 7.
The stomatal phenotype in ectopic MYB16 lines is rescued by high-percentage agar treatment. A, B, Quantification of stomatal density (A) and stomatal index (B) show the rescue of the stomatal phenotype in ectopic MYB16 lines under high-percentage agar treatment. Low, 0.8% agar (normal conditions), and high, 2.4% agar. n = 30 10-dpg seedlings. P < 0.01, Kruskal–Wallis test with Dunn’s test. Data are medians (interquartile range). Three biological replicates showed similar results. C, D, Stomatal cluster number (C) and cluster frequency (D) decrease after high-percentage agar treatment. For (C), the rescue percentage was calculated using the difference in cluster events between two types of agar treatments divided by the number of cluster events in low-percentage agar treatment. For (D), cluster frequency is the cluster event number divided by the number of stomatal groups; P < 0.05. One-way ANOVA with Tukey post hoc test. Data are means (se). Three biological replicates showed similar results. E–J, Confocal images of the polarity marker BRXL2 in 7-dpg true leaves from plants grown in two different concentrations of agar. BRXL2-CFP signal (green) is similar in the WT (E) and (H) but stronger in BASLp:MYB16-YFP (F) and (I) and CYP77A6p:MYB16-VP16 (G) and (J) after high-percentage agar treatment. K–M, The orientation of polarity is rescued in BASLp:MYB16-YFP and CYP77A6p:MYB16-VP16 after high-percentage agar treatment. The data were quantified from confocal images of 7-dpg true leaves expressing BRXL2 without PI staining. n = 587, 369, 321 cell pairs in (K)–(M), respectively. N, The rescue of the BRXL2 crescent size in ectopic MYB16 lines by high-percentage agar treatment. The calculation method is the same as in Figure 6Q. Sixty cells with peripheral BRXL2 were collected from each line under each treatment. The dot shows the Tukey outlier. P < 0.001, by one-way ANOVA with Tukey post hoc test. Data are medians (interquartile range). For (E)–(J), cell outline is labeled by PI (magenta). Scale bars, 50 µm in (E)–(J). For (K)–(N), data are combined from four individual lines of each background. See also Supplemental Figure S12.

