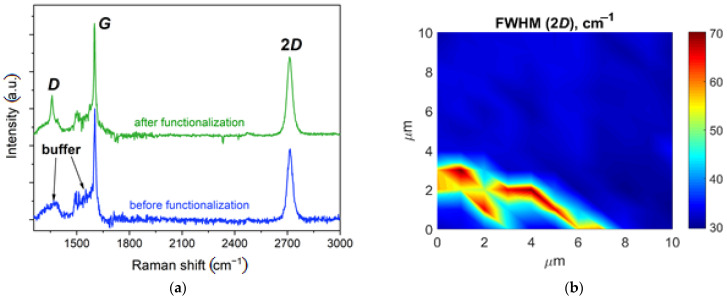
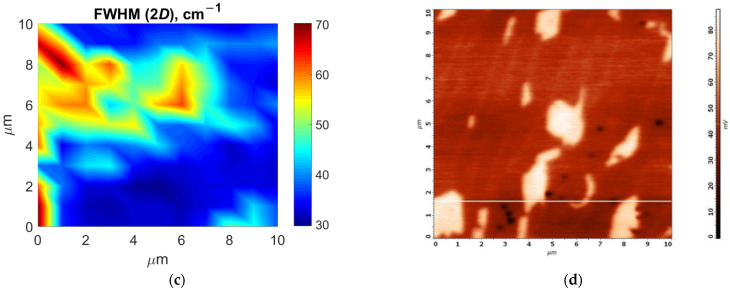
Figure 2.
Raman spectra of Group 1 and 2 chips before and after functionalization. (a) Typical Raman spectra of monolayer graphene areas in the chip before (blue line) and after (green line) functionalization. The spectra are presented after subtraction of the 4H-SiC substrate spectrum contribution. (b) Typical Raman maps of 2D line FWHM (full width at half-maximum) distribution for the chips from Group 1 with ~5% of bilayer inclusions. (c) Typical Raman maps of 2D line FWHM distribution for the chips of Group 2 with ~30% of bilayer inclusions. (d) A typical surface potential map of a chip from Group 2, which reveals the presence of bilayer inclusions as light spots of different sizes.


