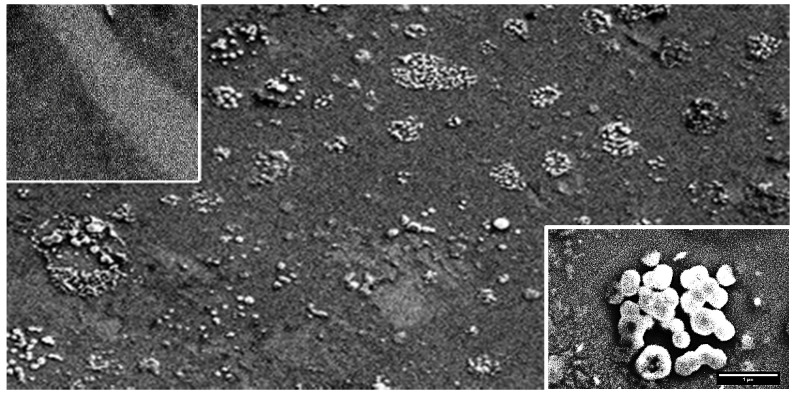
Figure 9.
SEM image of a 45 µm × 150 µm graphene chip from Group 1. Inset 1 (left, top) shows a 5 µm × 5 µm section with boundaries of functionalized graphene (dark areas) and non-functionalized graphene (light area in the middle). Inset 2 (right, bottom) shows a 2.7 µm × 4.2 µm region with virus aggregates, located in a recess with a facet close to a hexagonal structure.

