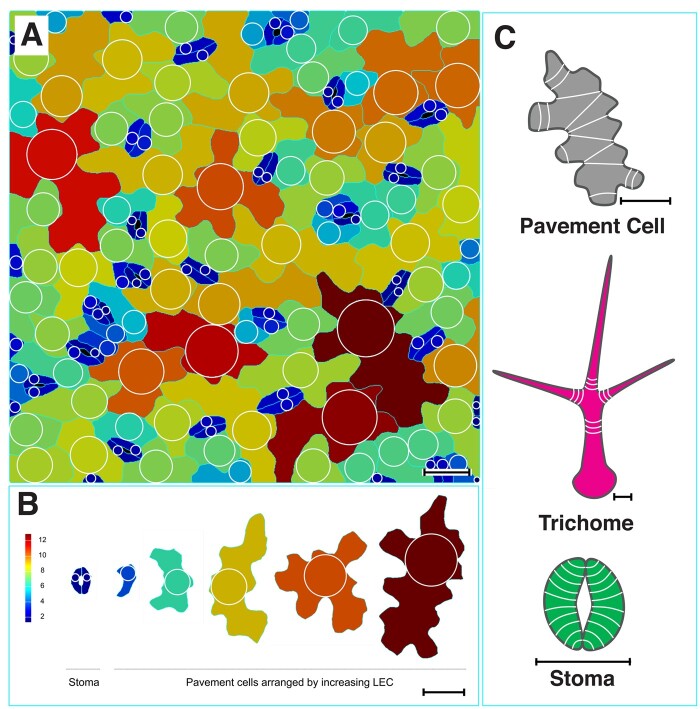
Figure 4.
Mechanical stress control of epidermal cell shape. A, Cells segmented in MorphoGraphX (Barbier de Reuille et al., 2015) with each large empty circle (LEC) visualized. B, Cells arranged by the size of the LEC, which indicates the magnitude of stress. Cells in (A) and (B) are colored according to the LEC, from cells with small LEC (2–4) in blue to those with large LEC (10–12) in red or brown. C, The stress patterns in the different cell types (white lines), which correspond with the localization patterns of cortical microtubules and cell wall cellulose microfibrils. Scale bars represent 20 µm.

