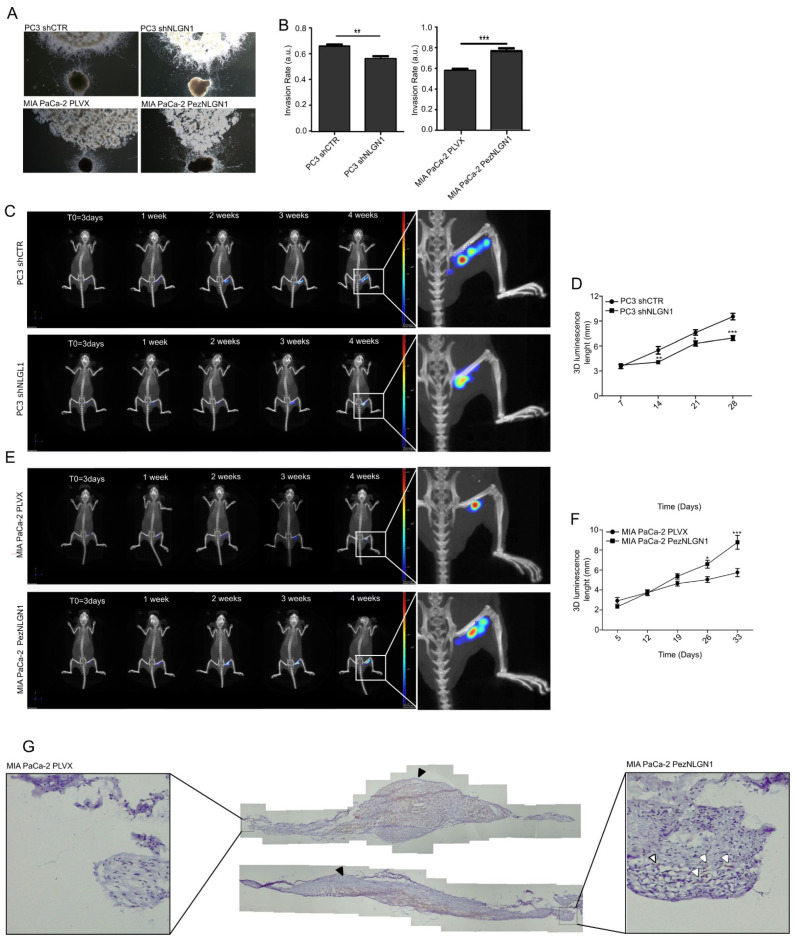
Figure 2.
NLGN1 triggers cell invasion along the nerves in an ex vivo and in vivo models of perineural invasion. (A) Co-culture of murine DRG with prostate (PC3 shCTR or PC3 shNLGN1 cells, upper panels) and pancreatic cancer cells (MIA PaCa-2 PLVX or PezNLGN1 cells, lower panels). Pictures were taken at 48 h and are representative of 1 of 3 reproducible experiments performed in quadruplicate (original magnification 2.5×). (B) Quantification of the invasion rate. Values are mean ± SE of 3 independent experiments. Unpaired Student’s t-test, two tailed: **, p < 0.01, ***, p < 0.001. (C–G) 3 × 10⁵ PC3 shCTR and PC3 shNLGN1 (C,D), or MIA PaCa-2 PLVX and MIA PaCa-2 PezNLGN1 (E–G) cells, further infected with a CMV-Luc vector, were surgically inoculated into the right sciatic nerve of 6-week-old NOD/SCID mice. IVIS images shown in (C,E) are representative of 1 of 6 mice. Graphs in (D,F) show the evaluation of the length (mm) of the bioluminescence of tumor cells along the sciatic nerve over time. Values are expressed as mean ± SE, n = 6. Unpaired Student’s t-test, two tailed: *, p < 0.05 **, p < 0.01, ***, p < 0.001. (G) Cytokeratin staining (brown) by IHC on two sciatic nerves that were injected either with control or NLGN1-overespressing MIA PaCa-2 cells, and next surgically extracted at the endpoint. The cellular distribution of cells in the main tumor is visible (the site of tumor cell injection indicated by the black arrowheads), while distally migrating tumor cells (shown in the magnification by white arrowheads) are visible only with NLGN1-overexpressing MIA PaCa-2 cells.

