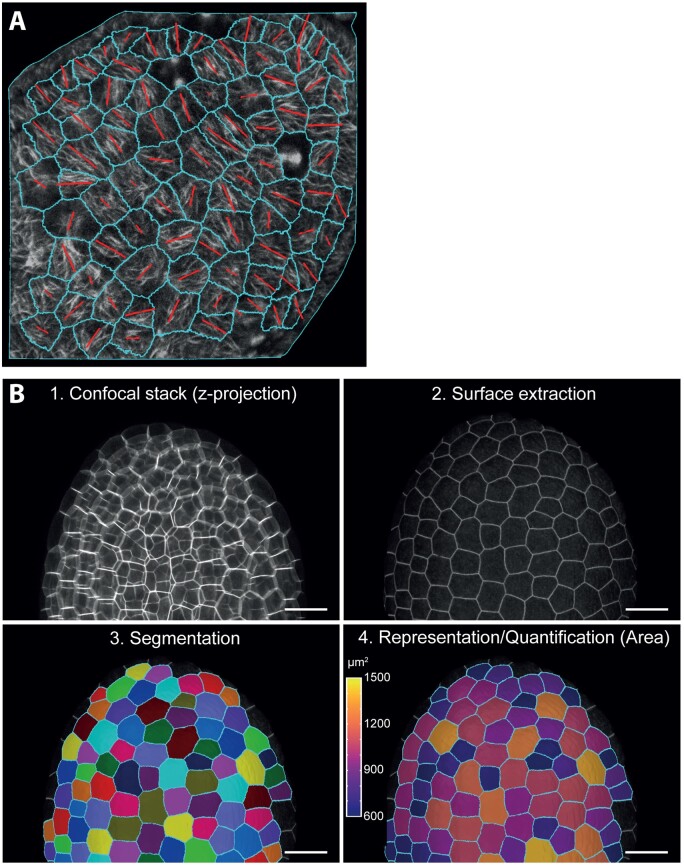
Figure 1.
Examples of image analysis using the developing Arabidopsis seed as a model. A, Analysis of microtubule organization (MAP65-1-RFP) in a developing Arabidopsis seed at 2 days after pollination (DAP) with FibriTool and MorphographX. Scale bar, 10 µm. The orientation and length of the red bar represent the mean orientation and degree of organization of the microtubule array in a given cell, respectively. B, Segmentation of a confocal stack of a developing Arabidopsis seed (5 DAP) expressing LTi6b-GFP analyzed using the level set method (LSM) (Kiss et al., 2017) and MorphographX (de Reuille et al., 2015). Scale bar, 50 µm.

