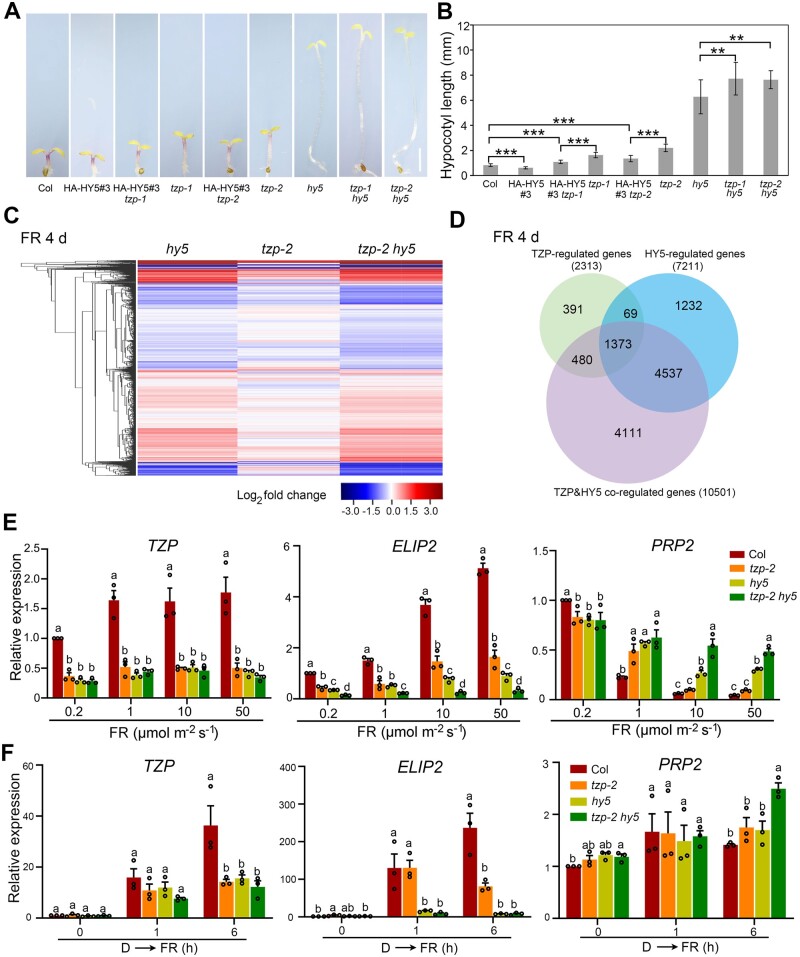
Figure 4.
HY5 and TZP coordinately regulate FR light signaling. A, Phenotypes of 4-day-old Col, tzp-1, tzp-2, hy5, tzp-1 hy5, tzp-2 hy5, HA-HY5#3, HA-HY5#3 tzp-1, and HA-HY5#3 tzp-2 seedlings grown in FR light (10 μmol m−2 s−1). Scale bar = 1 mm. B, Hypocotyl lengths of the respective seedlings shown in (A). Data are means ± sd from 15 seedlings. **P < 0.01 and ***P < 0.001 (Student’s t test; Supplemental Data Set S3) for the indicated pair of samples. C, Cluster analysis of genes whose expression was changed in 4-day-old FR-grown (10 μmol m−2 s−1) hy5, tzp-2, and tzp-2 hy5 seedlings compared with those in Col. The bar represents the log2 of the ratio. D, Venn diagram showing the numbers and overlaps of genes whose expression was changed in hy5, tzp-2, and tzp-2 hy5 seedlings compared with those in Col. E, RT-qPCR data showing the expression levels of TZP, ELIP2, and PRP2 in Col, tzp-2, hy5, tzp-2 hy5 mutant seedlings grown under different rates of FR light for 4 days. Error bars represent SE of three different pools of seedlings. Data are normalized to TUBULIN3. Different letters represent significant differences by one-way ANOVA with Duncan’s post hoc test (P < 0.05; Supplemental Data Set S3). F, RT-qPCR assays showing the relative expression of TZP, ELIP2, and PRP2 in 4-day-old Col, hy5, tzp-2, and tzp-2 hy5 mutant seedlings grown in the dark, and then transferred to FR light (50 μmol m−2 s−1) for 1 h and 6 h. Error bars represent se of three different pools of seedlings. Data are normalized to TUBULIN3. Different letters represent significant differences by one-way ANOVA with Tukey’s post hoc test (P < 0.05; Supplemental Data Set S3).

