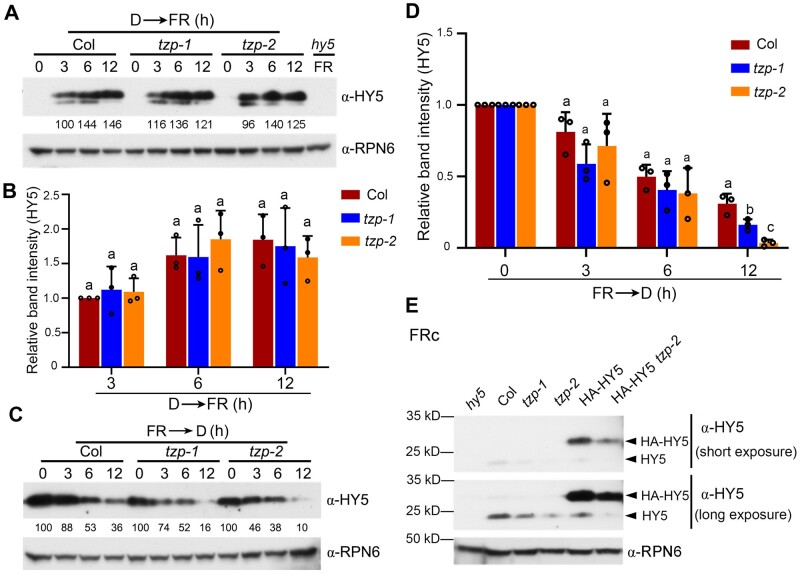
Figure 5.
TZP promotes HY5 protein abundance. A, Immunoblots showing HY5 protein levels in seedlings of Col and two tzp mutant lines grown in darkness (D) for 4 days and then transferred to FR light (50 μmol m−2 s−1) for the indicated times. Anti-RPN6 was used as a sample loading control. Numbers below the immunoblots indicate the relative band intensities of HY5 normalized to those of RPN6 for each panel. The ratio of the first clear band was set to 100. B, Relative intensities of the bands in (A). Data are means ± sd from three independent biological assays. Different letters represent significant differences by one-way ANOVA with Tukey’s post hoc test (P < 0.05; Supplemental Data Set S3). C, Immunoblots showing HY5 protein levels in seedlings of Col and two tzp mutant lines grown in FR (10 μmol m−2 s−1) for 4 days and then transferred to darkness (D) for the indicated times. Anti-RPN6 was used as a sample loading control. Numbers below the immunoblots indicate the relative band intensities of HY5 normalized to those of RPN6 for each panel. The ratio of the first band was set to 100 in Col, tzp-1, and tzp-2, respectively. D, Relative intensities of the bands in (C). Data are means ± sd from three independent biological assays. Different letters represent significant differences by one-way ANOVA with Tukey’s post hoc test (P < 0.05; Supplemental Data Set S3). E, Immunoblots showing the HY5 protein levels in 4-day-old Col, tzp-1, tzp-2, HA-HY5#3, and HA-HY5#3 tzp-2 seedlings grown in FR light (10 μmol m−2 s−1). Anti-RPN6 was used as a sample loading control.

