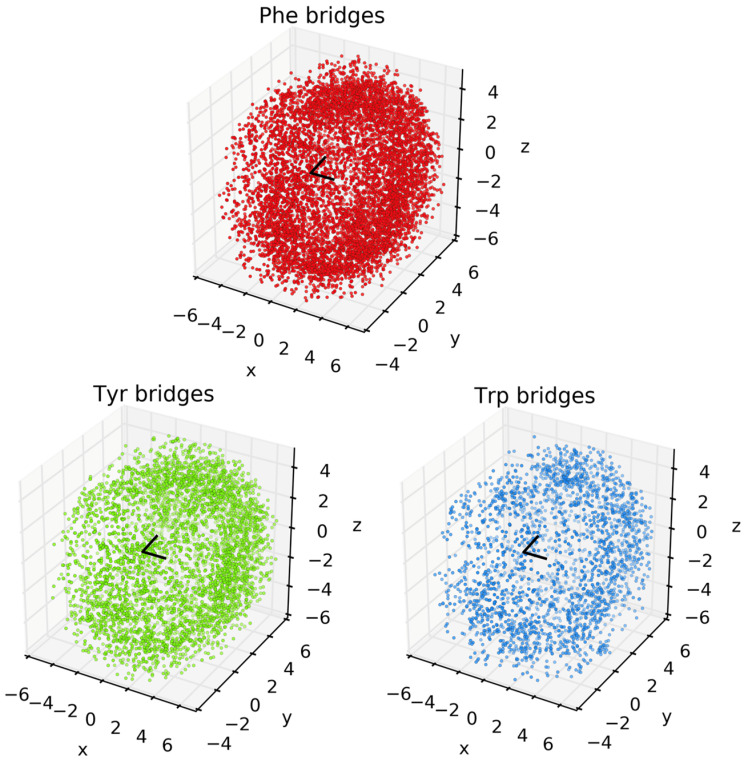
Figure 3.
Plots of clustering of Phe, Tyr, and Trp around Met. The x, y, and z axes are in Ångstroms. The black V-shape at the origin depicts the CH3-S-CH2 thioether of Met. The arm pointing away from the reader (along +y) is the CH2 group. Each point corresponds to an aromatic centroid for each respective amino acid.

